
KDP Royalties Calculator: The Metric That Matters More Than Your Totals
Summing royalties across platforms tells you what happened. Series read-through tells you whether the next book is worth writing — and whether ads pay.
Published August 2, 2026
Six platforms. Six monthly reports. Six formats, six schedules, six reporting lags, and one spreadsheet you paste them into when you get around to it.
The output of all that work is a total. And a total, honestly, answers a question you weren’t really asking. You want to know whether this is working — whether the series is healthy, whether the ads are worth it, whether the next book should be book four or the start of something new.
A sum of royalties cannot answer any of those.
The number that can: read-through
Series read-through is the percentage of readers who finish book one and buy book two, then book two to book three, and onward.
Compute it directly: book two units divided by book one units over the same period. Then book three over book two.
It matters more than any total because it’s the only metric in indie publishing that’s predictive rather than historical.
- Strong read-through means every reader you acquire is worth several books, not one. That’s what makes paid acquisition rational — you can spend more than book one earns, because book one isn’t where the money is.
- Weak read-through means every acquired reader is worth roughly one book, and advertising is amplifying a leak. The fix is editorial — the ending of book one, the opening of book two, the series promise — and no amount of ad optimisation touches it.
That distinction determines what you should do next, and it’s invisible in your royalty total. Two authors with identical monthly royalties can be in completely opposite situations, one compounding and one treading water.
Why ACOS on a single title misleads series authors
Ad platforms report cost against sales for the title you advertised. For a standalone book, that’s the right frame.
For a series, it’s actively misleading. An ad campaign on book one can show an unprofitable ACOS while being clearly profitable in reality, because the reader it acquired went on to buy three more books that campaign gets no credit for.
Judged on the single title, you’d switch the campaign off. Judged across the series, you’d increase the budget.
You cannot make that call without read-through. Which means series authors optimising ads on per-title ACOS alone are making a structurally wrong decision in one direction or the other, consistently.
Gross royalty versus real profit
The second gap: royalty reports show what platforms paid you. They know nothing about what the book cost to produce.
Cover, editing, formatting, proofreading, and ad spend all attach to a specific title. Subtract them and you get real profit per book — which occasionally reveals that a title in a catalog that looks fine in aggregate has never earned back its own production.
Aggregate health hides individual failures. That’s fine until you’re deciding what to write next, at which point it’s the single most useful thing to know.
What to actually consolidate
Four things:
- A royalty ledger with per-month rows by platform and format — ebook, print, audio — with units and net royalty, rolling up by platform and by book
- Read-through per series, book one through N
- Real profit per title — royalty minus ad spend minus production cost
- Ad performance judged against the series, not the single title
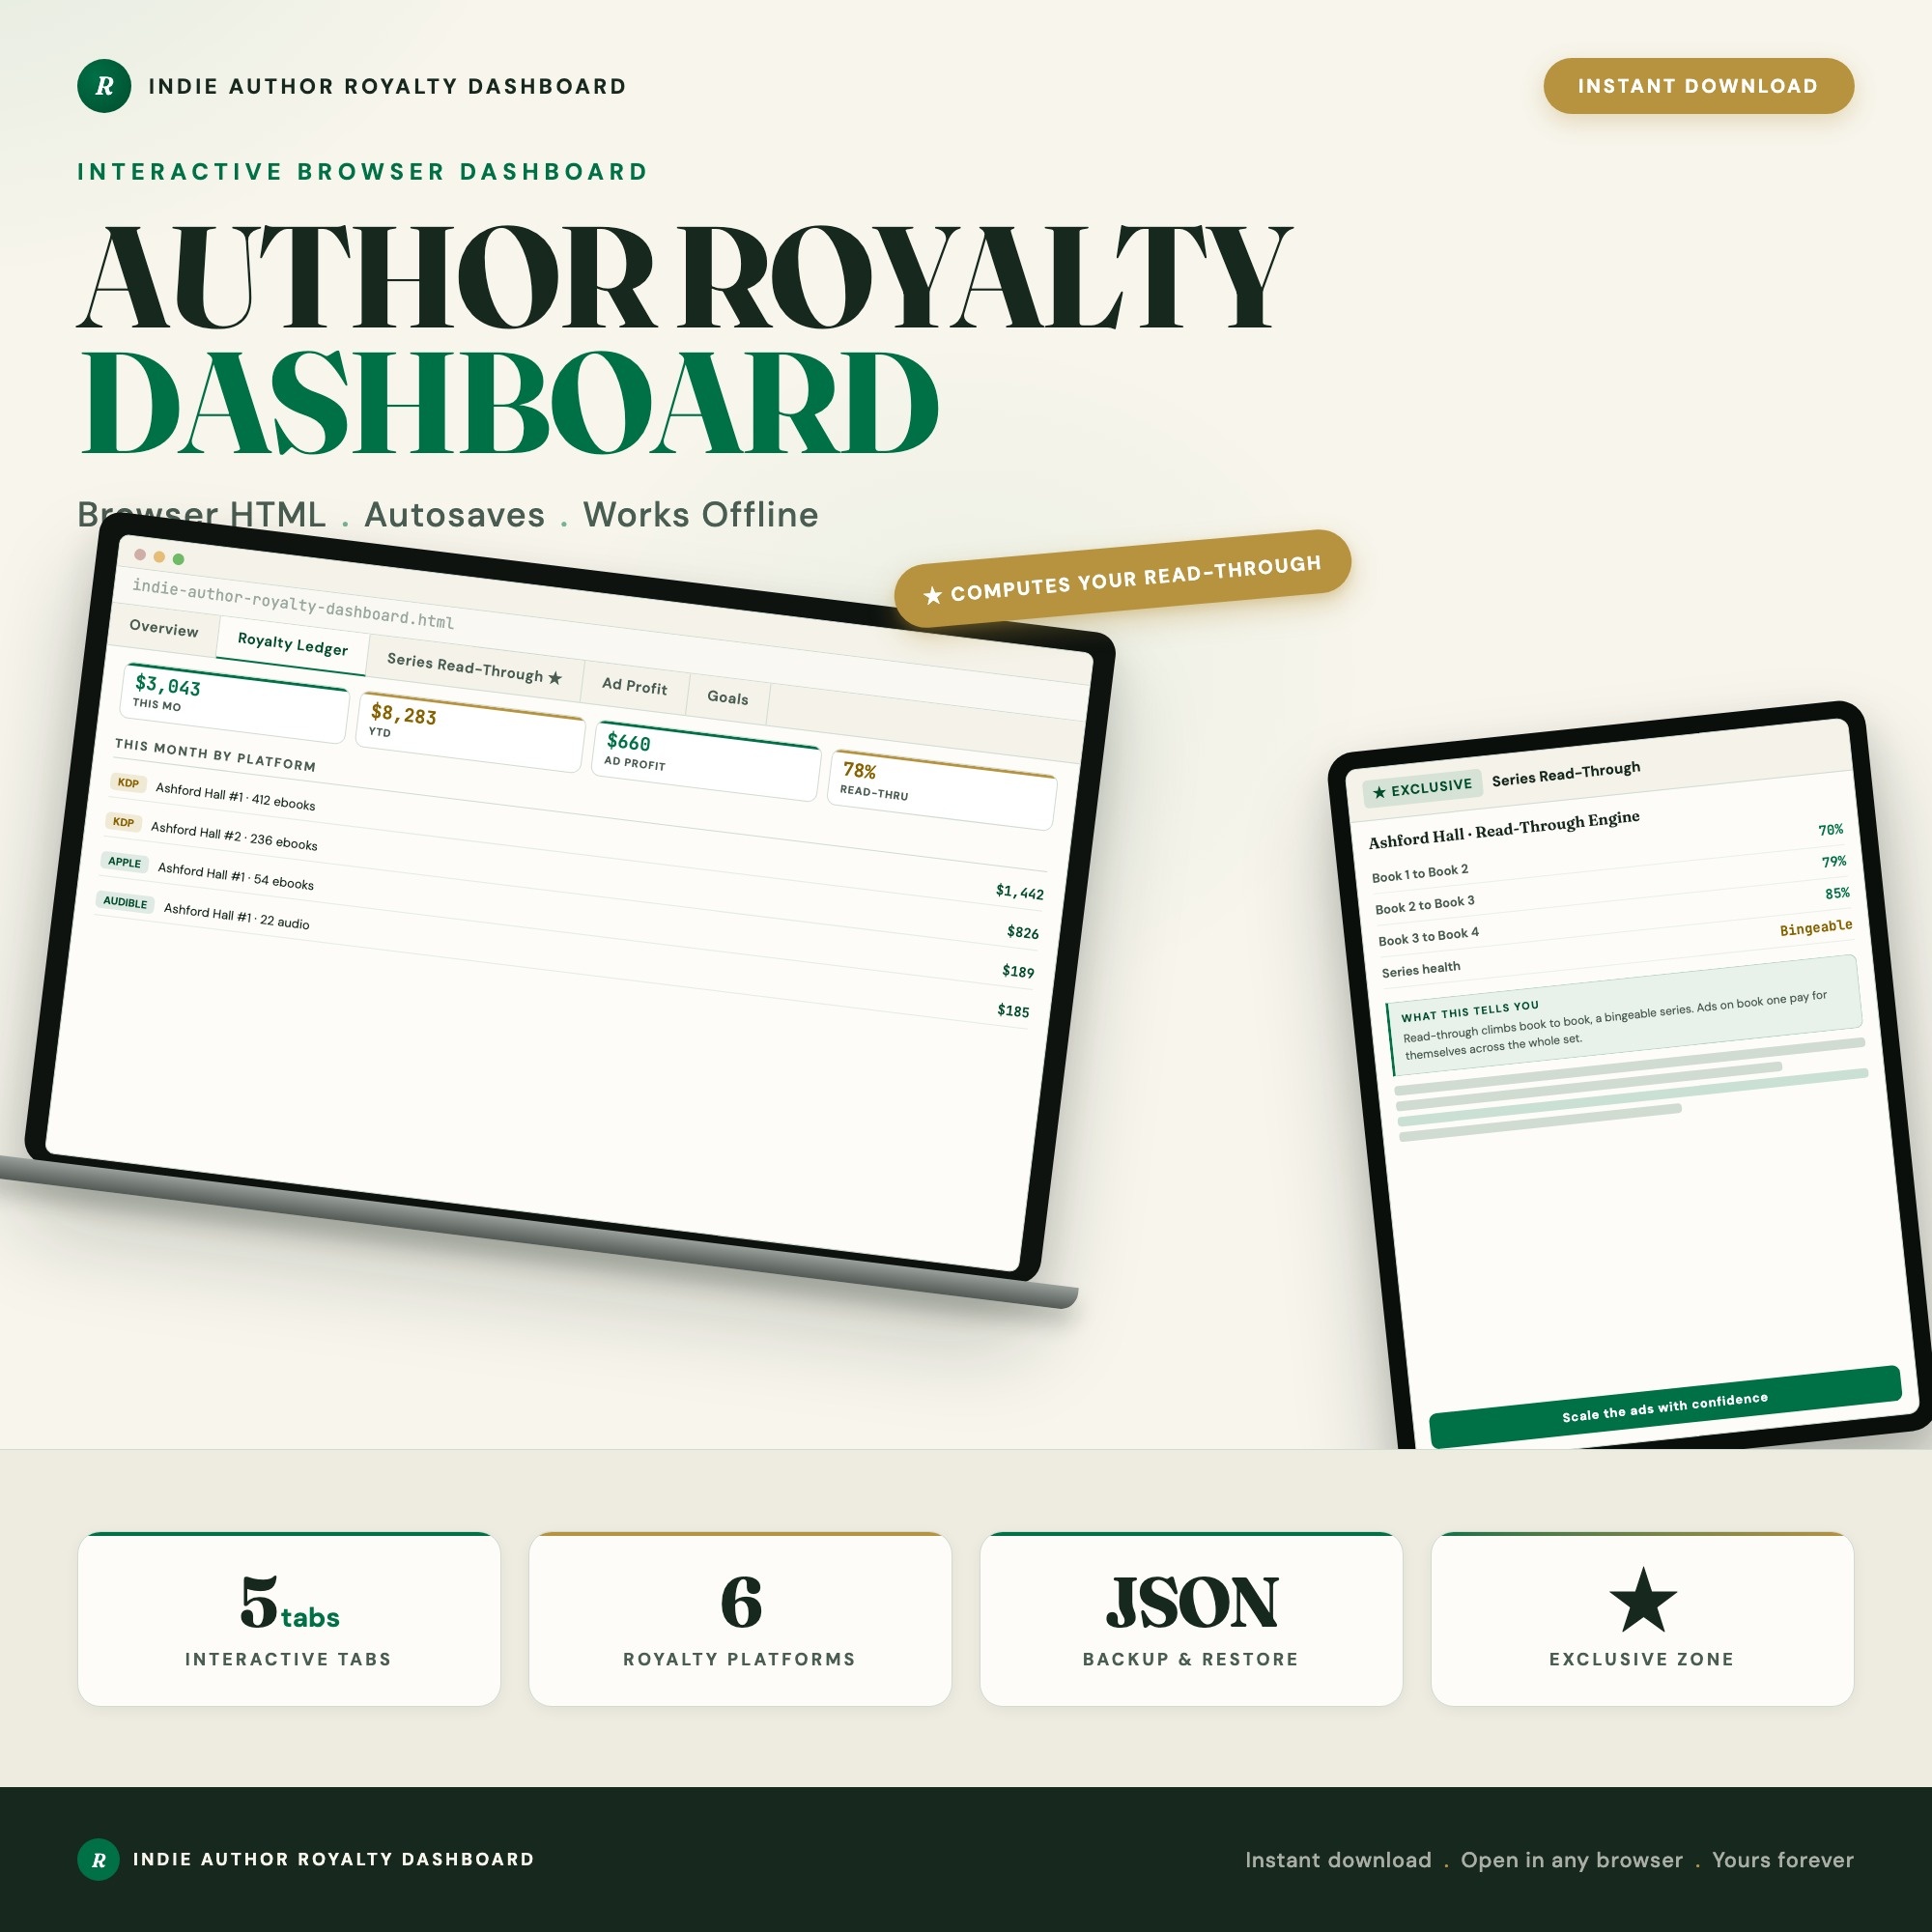
That’s the shape of the Indie Author Royalty Tracker. Its Series Read-Through view is the part worth having: enter units sold per book and it computes book-to-book read-through percentage, alongside a Real Profit view that takes royalty minus ad spend minus production cost so you see net rather than gross. The ledger underneath handles KDP, Apple, Kobo, Barnes & Noble, Google Play and Audible across ebook, print and audio. One browser file, no login, no subscription, and your sales data stays on your own machine.
The one calculation to run today
Take your longest series. Divide book two’s lifetime units by book one’s.
If that number is high, your problem is acquisition and you should be spending more to find readers. If it’s low, spending more will make things worse, and the work is in the books themselves.
Most authors have never run it, and it’s the number that decides what they should do for the next year.
Frequently asked questions
- What is series read-through and how do I calculate it?
- Divide book two's units sold by book one's units sold over the same period, then book three by book two, and so on. It tells you what share of readers who started the series continued. It is the closest thing indie publishing has to a quality signal you can measure rather than guess.
- Why does read-through matter more than total royalties?
- Because totals are backward-looking and read-through is predictive. Strong read-through means every new reader you acquire is worth several books rather than one, which is what makes ad spend rational. Weak read-through means paid acquisition amplifies a leak, and the fix is editorial rather than promotional.
- How do I know if my ads are profitable?
- Compare ad spend against royalty earned on that title, and then against the series it feeds. An ad campaign that loses money on book one can still be profitable if read-through carries buyers through books two and three — which is exactly why ACOS on a single title, judged alone, is a misleading number for series authors.
- What is the difference between gross royalty and real profit?
- Gross royalty is what the platforms paid you. Real profit subtracts ad spend and production costs — cover, editing, formatting, proofreading — for that specific title. Authors who track only gross can run a catalog that looks healthy in aggregate while individual titles never earn back what they cost to make.
- Why is combining platform reports so difficult?
- Every store issues its own report on its own schedule, in its own format, with different currency and reporting lags. There is no shared standard, so consolidation is manual by nature — which is why most authors do it sporadically and end up making decisions on partial data.
Ready-made dashboards
Skip setup — grab an interactive dashboard built for this exact workflow.
ListingResearchOS Shop
All dashboards — one-time purchase, yours forever
Single HTML files. No subscriptions. No login. Works offline in any browser.
Browse all dashboards →