
How to Calculate a Reorder Point (Without Guessing)
The reorder point formula explained for small product sellers — sales velocity, supplier lead time, and safety stock, with a worked example.
Published July 27, 2026
Most stock spreadsheets answer one question: how many do I have? That is the wrong question. The useful one is how long will that last, and it is the question a static spreadsheet almost never answers.
That gap is why the same two mistakes keep happening to product sellers. You sell out of your best item during your best week. And you have four hundred units of something that has not moved since the day it arrived.
Units on Hand Is a Misleading Number
Say you have two products. One has 34 units left, the other has 400.
Which one is urgent?
You cannot tell yet — and that is the whole point. If the 34-unit product sells 3.3 a day, you have about ten days before it hits zero. If the 400-unit product sells 2 a month, you have years of it, and a lot of cash sitting on a shelf.
Ranked by units, the 400 looks safe and the 34 looks low. Ranked by days of cover, the picture flips: one is a fire, the other is frozen capital. Days of cover is just:
quantity on hand ÷ average units sold per day
That single division is the most useful calculation in small-scale inventory, and it is the one most spreadsheets never do.
The Reorder Point Formula
A reorder point is the stock level at which you must place the order — not the level at which you run out. The difference between those two is your supplier’s lead time.
Reorder point = (average daily sales × lead time in days) + safety stock
Work through it. A candle maker sells a cedar 8oz at 3 units a day. Their wax supplier takes 14 days from order to delivery. They keep a 7-day buffer.
- Daily sales: 3
- Lead time: 14 days → they will sell 42 units while waiting
- Safety stock: 7 days × 3 = 21 units
- Reorder point: 63 units
So when that SKU drops to 63, the order goes in — even though 63 units still feels like plenty. Wait until it looks low, at say 20 units, and you are guaranteed to be out of stock for roughly a week before the delivery lands.
Notice what the formula needs: your real sales rate, and your real lead time. Not estimates you made up once and never revisited.
Sales Velocity Has to Be Measured, Not Guessed
The weak link is almost always daily sales. People estimate it from memory, and memory rounds toward whatever happened most recently.
The fix is unglamorous: log every movement in and out — received, sold, adjusted, damaged, returned — and let velocity fall out of the log. Count the units sold inside a window (30 days is a sensible default) and divide by the window length. That is your measured rate.
Choose the window deliberately:
- Shorter window (14 days) reacts fast to changing demand, but a single busy weekend can distort it.
- Longer window (60–90 days) smooths seasonality, but reacts slowly when something starts trending.
Thirty days is the usual compromise.
Lead Time Is Per Supplier, Not Per Business
One number sinks more reorder calculations than any other: a single company-wide lead time.
Lead times belong to suppliers, not to you. A label printer might turn around in 7 days while a glass vessel supplier takes 28. Using one average across both means you over-order from the fast supplier and run dry on the slow one — the exact opposite of what you want.
Record lead time per supplier, and record the minimum order quantity while you are there. An MOQ of 250 changes what “order more” actually means.
The Inverse: Finding Frozen Cash
Run the same maths backwards and it surfaces the other half of the problem.
Any SKU with no sales inside your window is dead stock. Multiply its quantity on hand by its unit cost and you have the dollar figure — the cash sitting on your shelf instead of in your account. Five slow SKUs at a few hundred dollars each add up to real money you could have spent restocking the products that actually sell.
Most sellers know they have slow movers. Very few can say what those slow movers cost them, because nobody ever computes it.
One File That Does the Maths
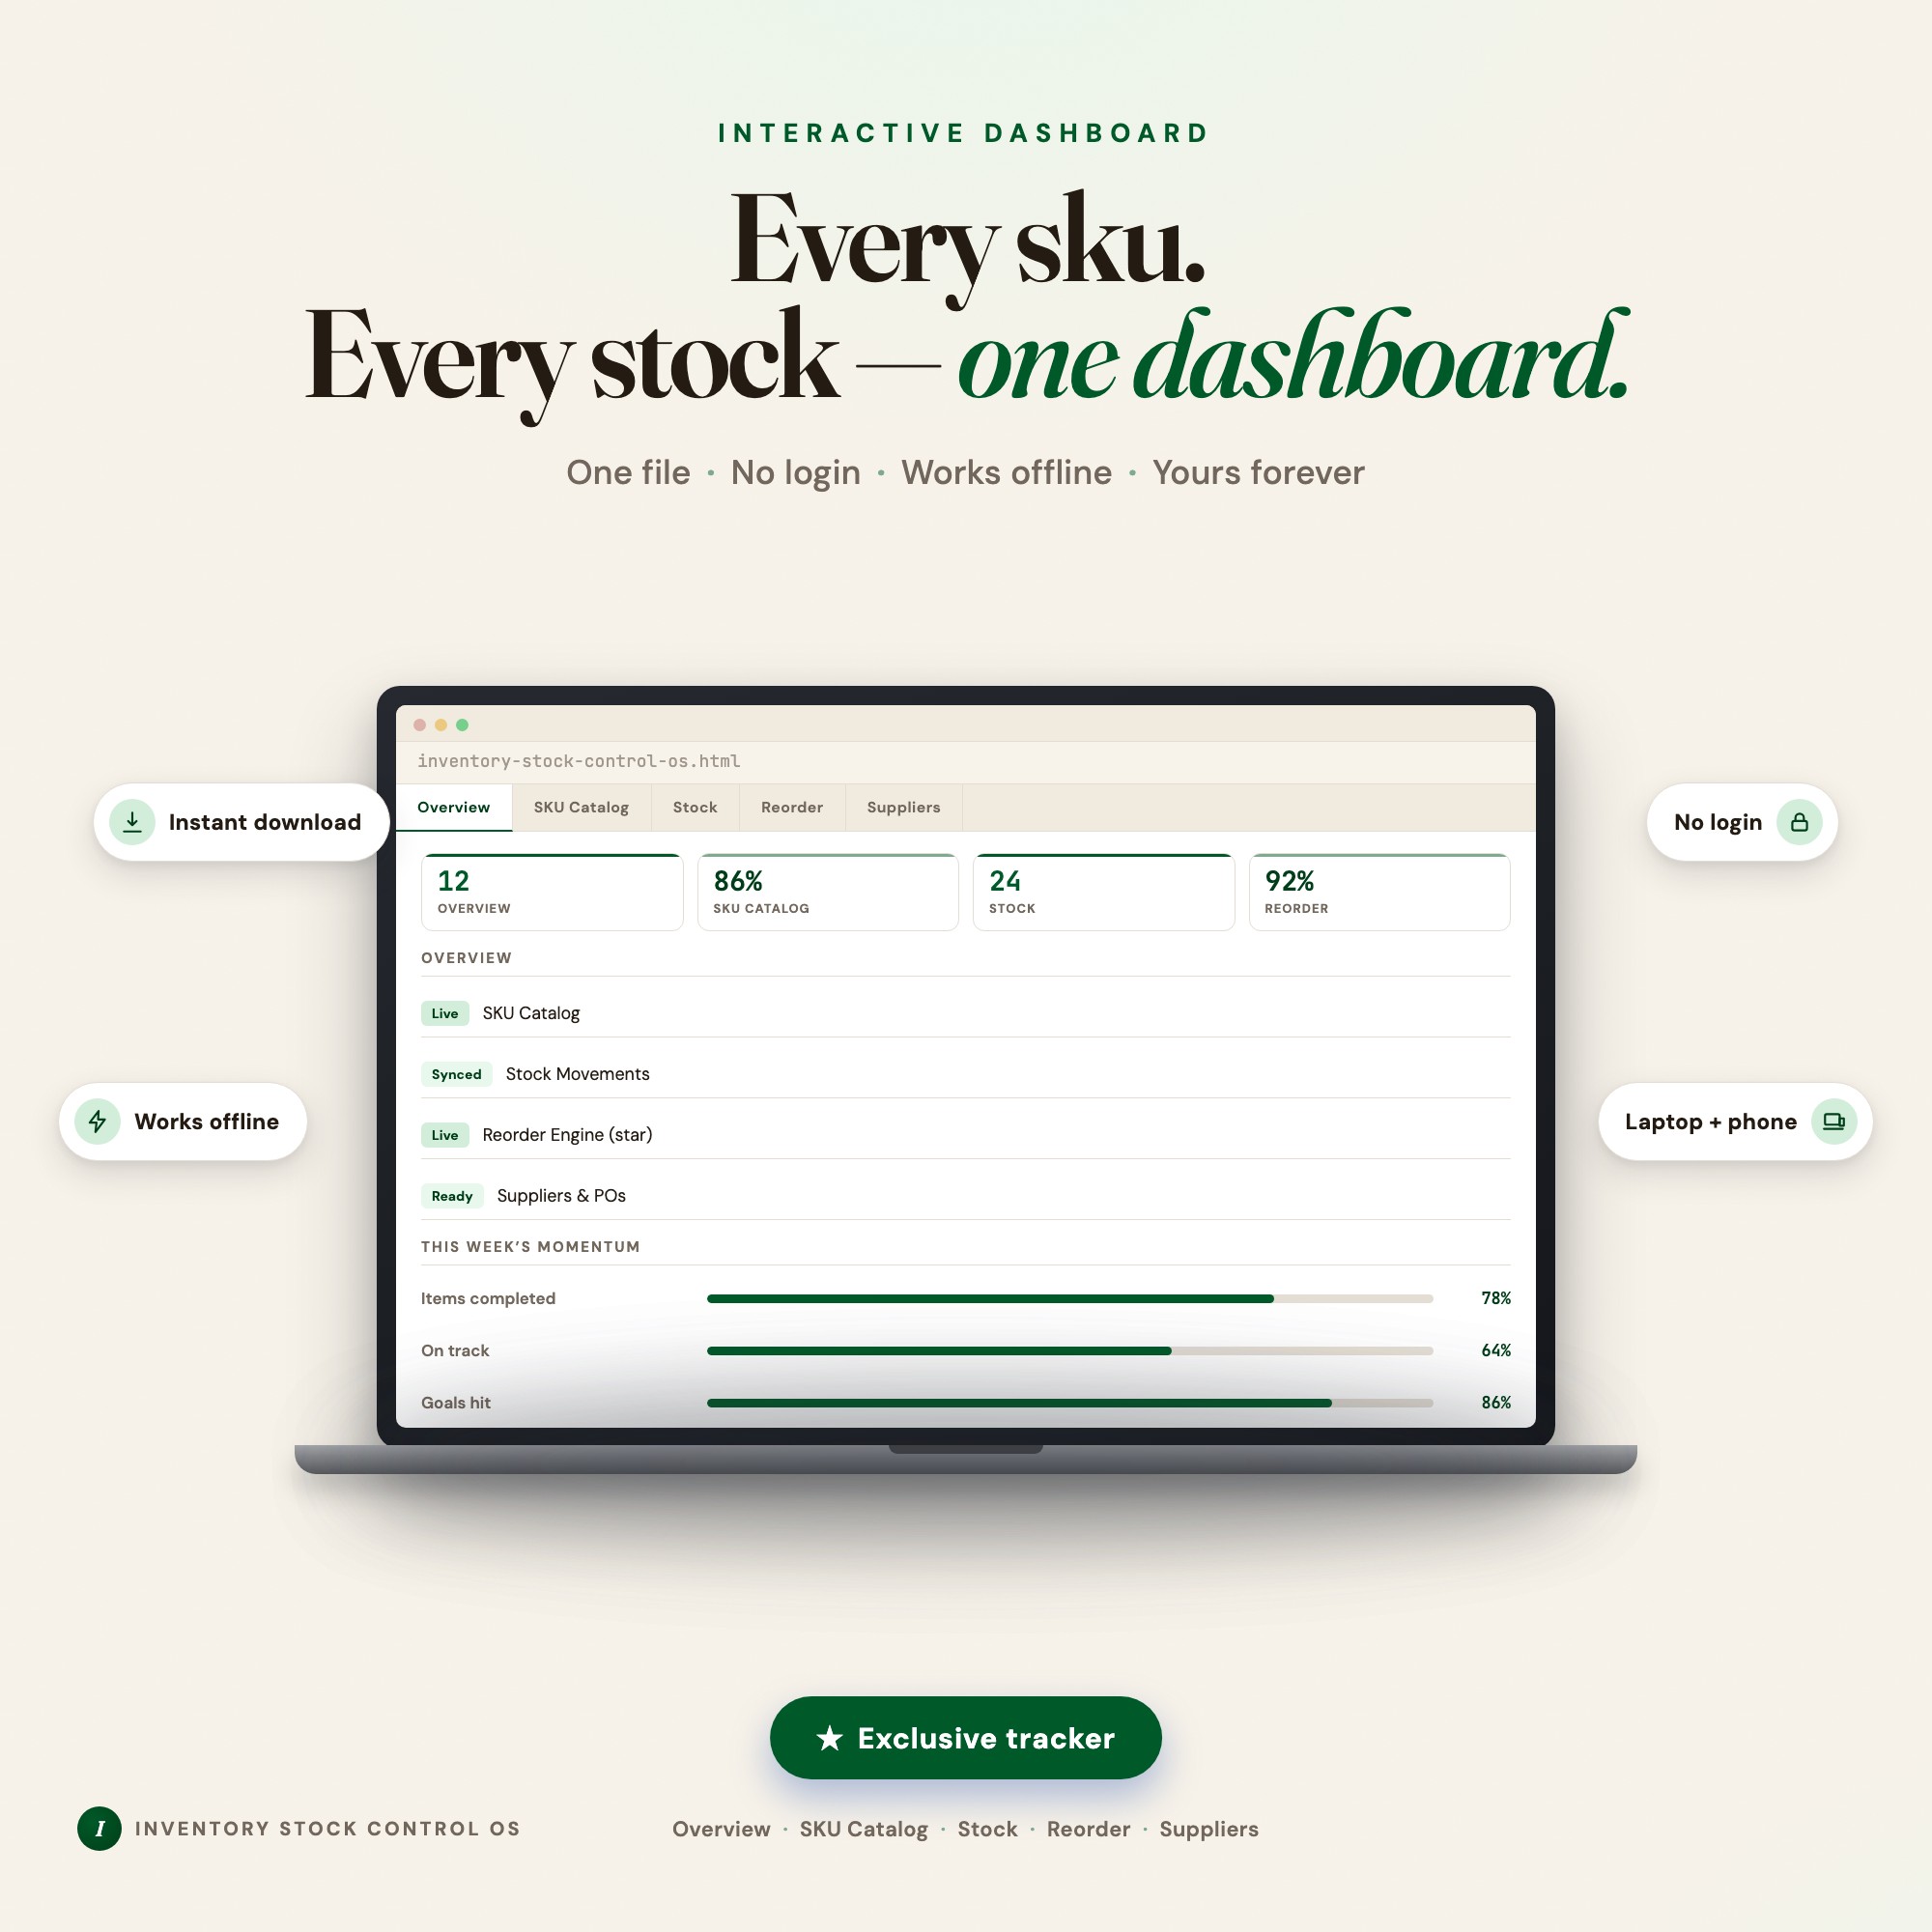
Inventory & Stock Control OS was built around exactly these calculations. It is an interactive browser dashboard — no login, no subscription, no marketplace connection — holding your SKU catalog, a stock-movement log, supplier lead times, and open purchase orders in a single file.
Its Reorder Engine measures each SKU’s velocity from your own movement log, multiplies it by that supplier’s lead time, adds the safety-stock buffer you set, and produces a live reorder point that updates as you type. It ranks what to order today by days of cover, so the item that runs out soonest is always at the top regardless of unit count. The same engine inverts to flag every non-moving SKU with the exact capital frozen in each.
Everything is calculated from data you enter yourself and saves locally in your browser. It does no accounting, connects to no store, and there is no barcode scanning — it is a planning tool, and the reorder points are estimates driven by the window and buffer you choose.
See Inventory & Stock Control OS → — one-time $24, works offline, yours for life. Or browse the full shop.
The Takeaway
Stop reading your stock list by quantity. Measure how fast each product actually sells, learn each supplier’s real lead time, and convert both into days of cover. The reorder point stops being a guess the moment those two numbers are real — and the cash frozen in your slow movers stops being invisible.
Frequently asked questions
- What is the reorder point formula?
- Reorder point = average daily sales x supplier lead time in days, plus a safety-stock buffer. If you sell 3 units a day and your supplier takes 14 days, you will sell 42 units while waiting on the delivery — so 42 is your bare minimum, and the safety buffer is what protects you when either number moves.
- How much safety stock should I carry?
- Express it in days of cover, not units. Seven days is a reasonable starting buffer for a reliable supplier and steady sales. Raise it if your supplier slips deadlines or your sales spike unpredictably; lower it if cash is tight and your lead times are dependable.
- Why do I keep running out of my bestseller and overstocking slow items?
- Because quantity on hand says nothing about how long it will last. A product with 34 units can run out sooner than one with 400 — it depends entirely on how fast each one sells. Ranking by days of cover instead of by units on hand reverses that blind spot.
- What counts as dead stock?
- Any SKU with no sales inside a window you choose — 30, 60, or 90 days is typical. The number that matters is not the unit count but the cash tied up in it: quantity on hand multiplied by unit cost. That figure is what you could have spent restocking something that actually moves.
Ready-made dashboards
Skip setup — grab an interactive dashboard built for this exact workflow.
ListingResearchOS Shop
All dashboards — one-time purchase, yours forever
Single HTML files. No subscriptions. No login. Works offline in any browser.
Browse all dashboards →