
Rental Property Investment Spreadsheet: The Four Numbers It Must Return
Most landlord spreadsheets record rent and expenses but never calculate returns. Here are cap rate, cash-on-cash, NOI and cash flow, and how they differ.
Published August 2, 2026
Ask a landlord with six units what their portfolio returns and you’ll usually get a pause, then an estimate, then a caveat about needing to check a spreadsheet.
That’s not carelessness. It’s what happens when the record-keeping and the analysis live in different places. The spreadsheets track what happened — rent in, expenses out — and the returns require a second calculation nobody has set up, so it gets done occasionally, by hand, and then goes stale.
Four numbers, and they answer different questions
The reason “what does it return” is hard to answer is that there are four legitimate answers and they’re routinely confused.
Net operating income (NOI). Rental income minus operating expenses — taxes, insurance, maintenance, management, utilities you cover, vacancy allowance. Debt service is excluded. That exclusion is deliberate and it’s the point: NOI describes the building’s performance independent of how you financed it.
Cap rate. NOI divided by property value. Also mortgage-blind. This is how you compare two properties as assets — a way of asking “what does this building yield” without your loan terms contaminating the answer.
Monthly and annual cash flow. NOI minus debt service. Now the mortgage is back in, and this is the number that hits your bank account. A property can have a healthy cap rate and negative cash flow if it’s leveraged aggressively enough.
Cash-on-cash return. Annual pre-tax cash flow divided by the actual cash you invested — down payment, closing costs, initial rehab. This measures your position, not the property. Two investors who buy the same building at the same price have identical cap rates and can have wildly different cash-on-cash returns, entirely because one put 20% down and the other paid cash.
Confusing these is how landlords end up defending a purchase with a cap rate while the property quietly loses money every month.
The vacancy allowance almost nobody includes
Model at 100% occupancy and every number above is optimistic in a way that compounds across a hold period.
Units turn over. Turnover costs lost rent and make-ready — paint, cleaning, repairs, listing time. A property that has been occupied for three straight years has not escaped this; it has deferred it.
Including a vacancy allowance makes your returns look worse and your decisions better. It is the single most common omission in landlord spreadsheets, and it’s the one that turns a marginal deal into an apparently good one on paper.
Why the spreadsheet approach breaks at scale
With one property, four disconnected sheets are annoying. With six, three specific things fail:
Portfolio-level totals require manual aggregation. Your actual position — total monthly cash flow, portfolio occupancy, net equity — lives in no single cell. So you compute it occasionally and operate on a stale figure between times.
Assumptions can’t be tested. The genuinely useful question is “what happens to my return if I raise rent $75 on unit 4, or if my insurance jumps 20%.” In a static sheet that’s a manual recalculation, so it doesn’t get asked, so rent increases get decided by feel.
Lease expirations are in a different file from the money. Which means you discover a lease ending when you look, not when it matters.
What a working setup does
Records and returns in the same place, recalculating live:
- A portfolio overview with total units, occupancy, total monthly cash flow, estimated value and net equity across everything
- A properties registry with purchase price, current value, mortgage details and rent per unit — the foundation the rest reads from
- A rent roll with lease start and end dates, deposits, and payment status, so expirations surface before they arrive
- Cash flow and expenses per property
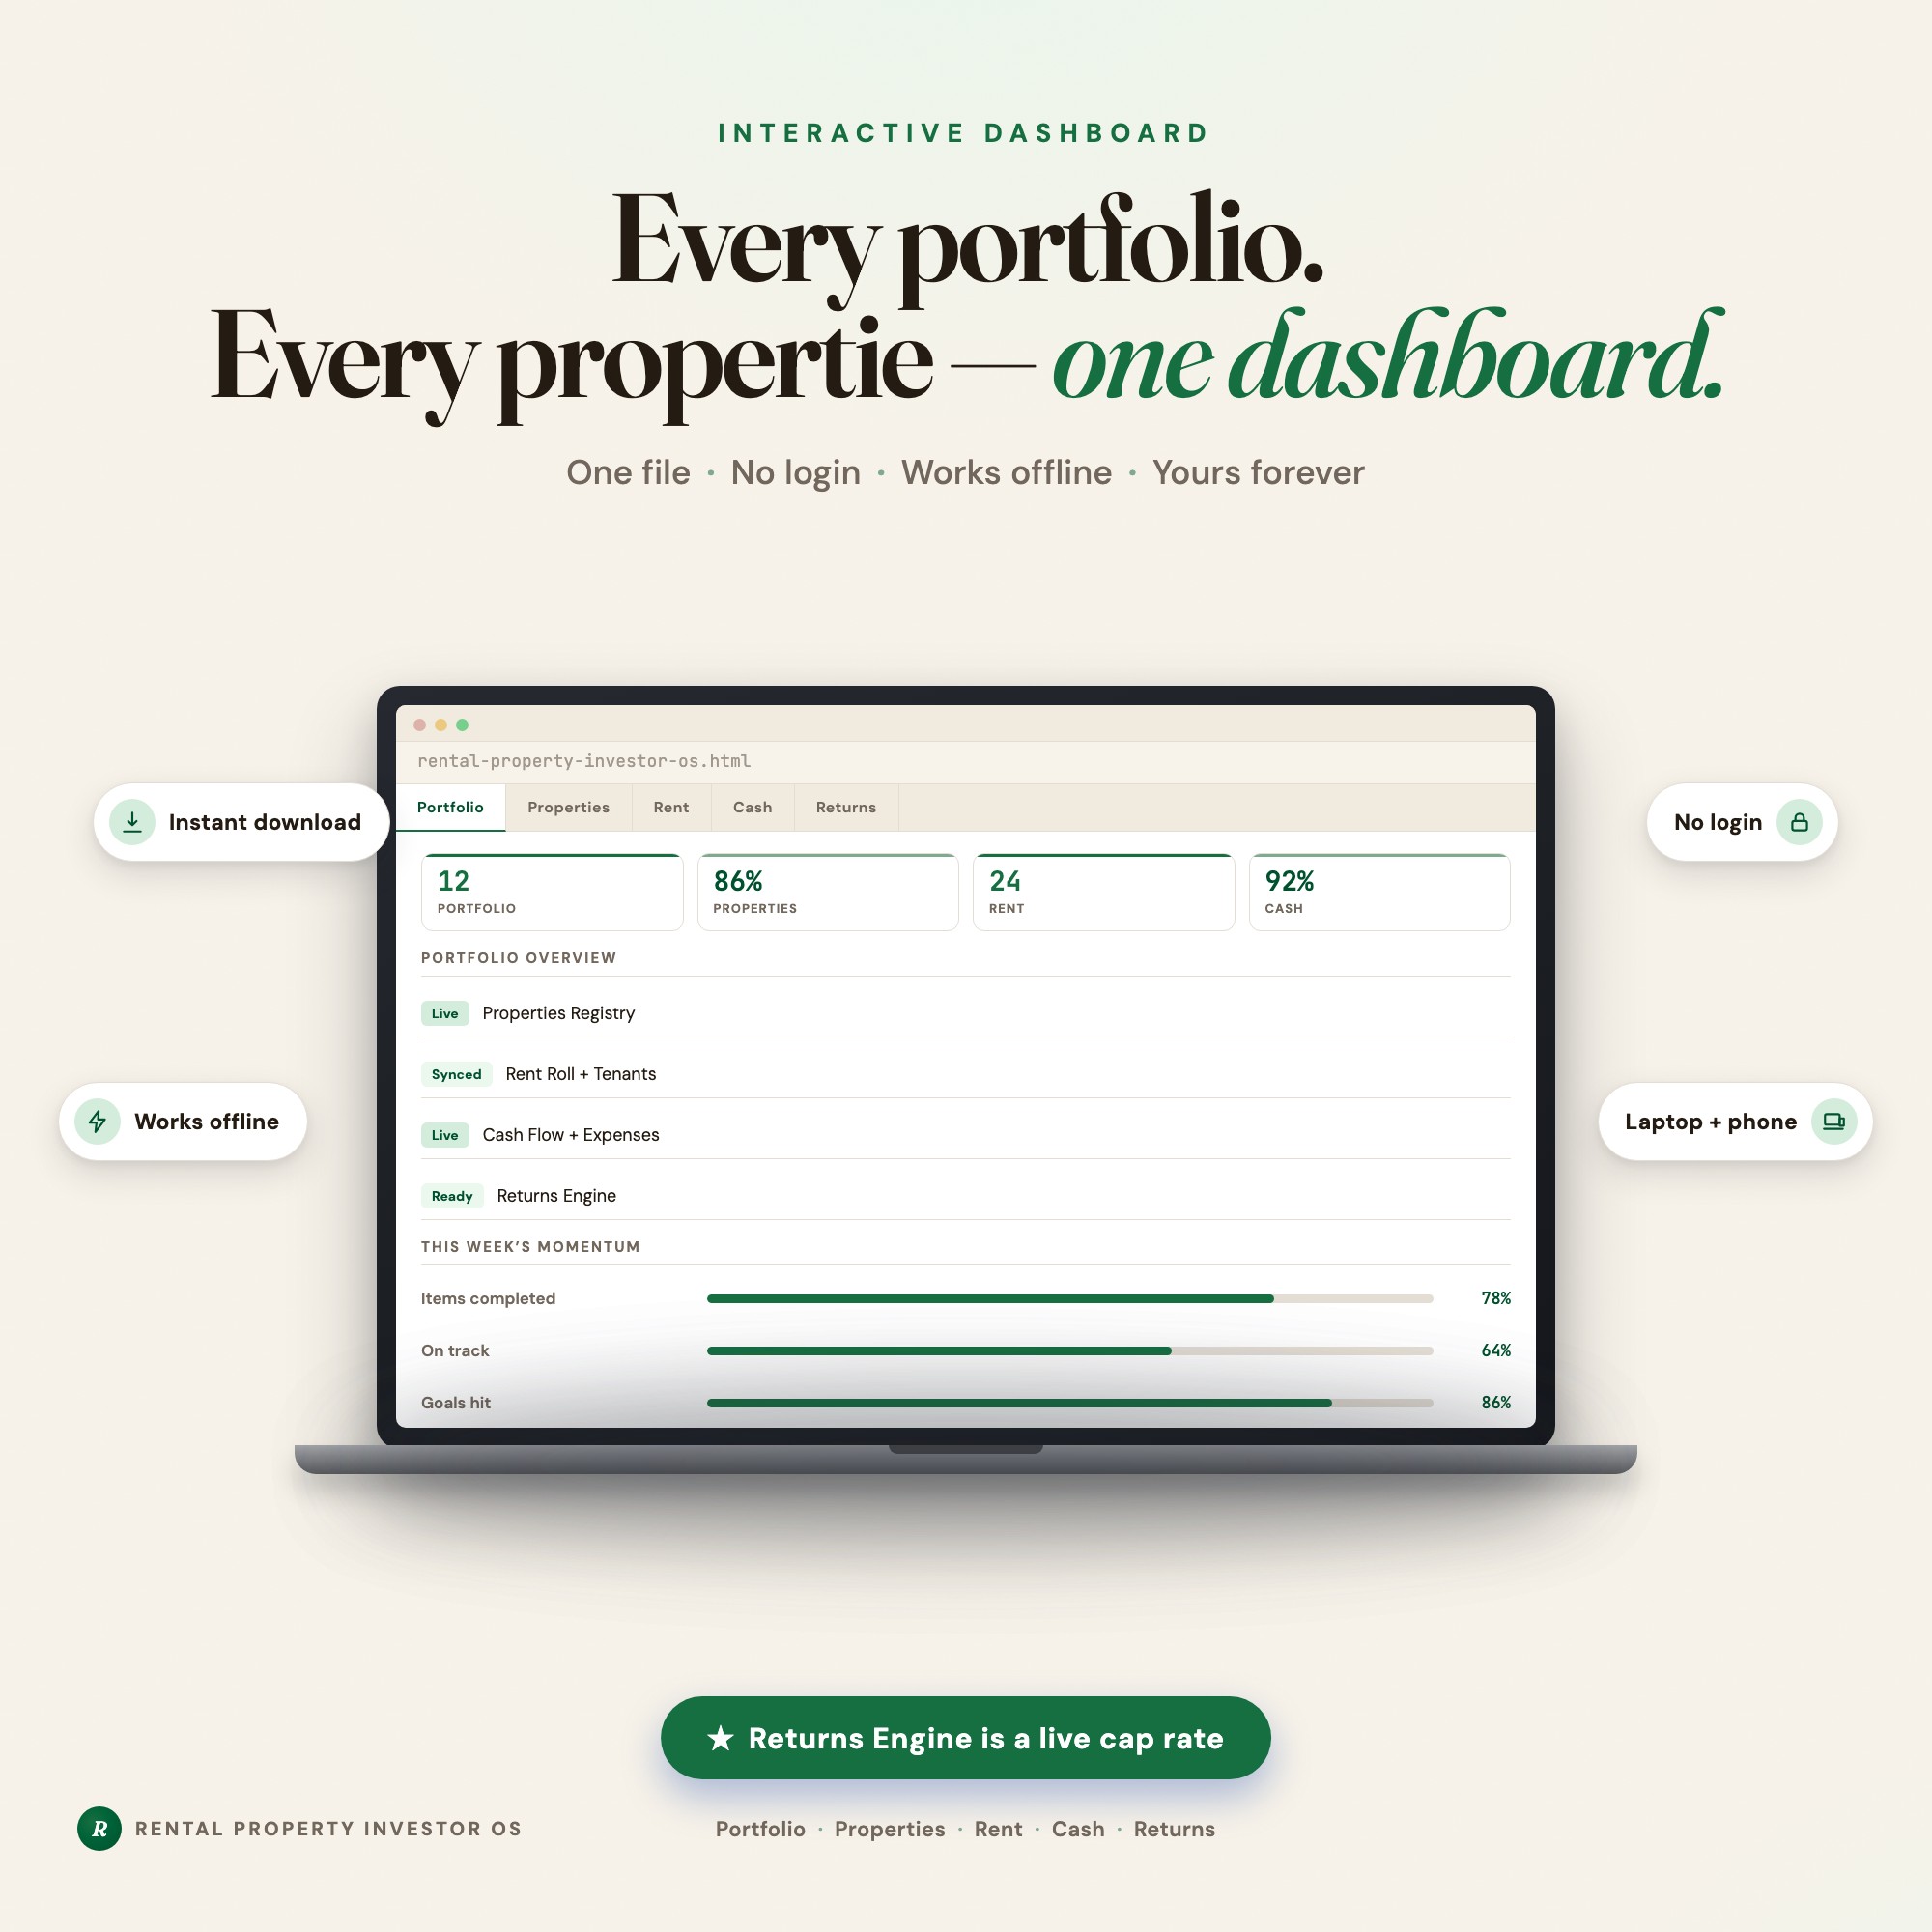
- A returns engine that takes purchase price, rent, expenses and mortgage and returns cap rate, cash-on-cash, NOI, monthly and annual cash flow, estimated equity, and portfolio totals — recalculating the moment any assumption changes
That last piece is what the Rental Property Investor OS is built around, and it’s the difference from a static template: change a rent assumption and every downstream number updates immediately, so testing a decision costs seconds instead of an evening. It runs as one HTML file in any browser, no login, no subscription, and tenant and financial records stay on your own device.
The one to check first
Run cash-on-cash on every property you own, separately.
Most portfolios have one property meaningfully dragging the average — usually one bought earliest, on the worst terms, with rent that never got raised. It’s invisible in a portfolio total and obvious the moment you list the properties side by side.
Frequently asked questions
- What is the difference between cap rate and cash-on-cash return?
- Cap rate is net operating income divided by property value, and it deliberately ignores your mortgage — it measures the property. Cash-on-cash is annual pre-tax cash flow divided by the actual cash you put in, and it very much includes the mortgage — it measures your position. Two investors buying the identical building at the same price have the same cap rate and completely different cash-on-cash returns.
- What counts in net operating income?
- Rental income minus operating expenses: taxes, insurance, maintenance, management, utilities you cover, and a vacancy allowance. Debt service is excluded by definition — that exclusion is what makes NOI comparable between a leveraged and an unleveraged property.
- Why exclude the mortgage from NOI?
- Because financing is a fact about you, not about the building. Excluding it lets you compare two properties on their own performance, and it is why NOI is the input to cap rate. Once you want to know what lands in your pocket, you add debt service back and look at cash flow instead.
- Should I include a vacancy allowance if my unit is always occupied?
- Yes. A unit occupied for three straight years will still turn over eventually, and turnover carries both lost rent and make-ready cost. Modelling returns at 100 percent occupancy produces numbers you cannot hit across a full hold period.
- What is a good cash-on-cash return?
- It depends on your market, your leverage, and what else you could do with the money, so a single benchmark number is not worth quoting. The useful comparison is across your OWN properties and against your alternatives — the property in your portfolio with the worst cash-on-cash is the one worth examining, whatever the absolute figure is.
Ready-made dashboards
Skip setup — grab an interactive dashboard built for this exact workflow.
ListingResearchOS Shop
All dashboards — one-time purchase, yours forever
Single HTML files. No subscriptions. No login. Works offline in any browser.
Browse all dashboards →