Podcast + Newsletter Business: How to Track Growth Without Analytics Overwhelm
Track podcast and newsletter growth with one system — downloads, open rates, sponsors, and a 30-day growth brief without analytics platform overwhelm.
Published June 3, 2026
Running a podcast and a newsletter simultaneously is essentially running two publishing businesses at once. Each has its own content calendar, its own audience, its own growth signals, and its own monetization path. The analytics overwhelm that hits 1-person media operators usually isn’t from having too much data — it’s from having data that lives in completely separate places, making it impossible to see the whole picture at once.
This guide covers how to track what actually matters for a podcast-plus-newsletter business without drowning in platform dashboards.
The Five Metrics That Drive a 1-Person Media Business
Every analytics platform shows you 40 numbers. You need five:
- Podcast downloads per episode — not the all-time total, but the 30-day post-publish download count for each episode. This tells you whether your audience is growing, flat, or declining in actual listening engagement.
- Newsletter subscribers — total count and weekly net change (new subscribers minus unsubscribes). A flat download count combined with strong subscriber growth suggests your newsletter is outpacing your podcast.
- Newsletter open rate — your average over the last 8–10 issues. Below 25% suggests subject line or deliverability issues; above 45% suggests a highly engaged core audience.
- Active sponsor prospects and their status — which brands you’ve pitched, which have responded, where each conversation stands, and what deliverables are attached to any closed deals.
- Revenue this month vs. last month — sponsorship revenue, Substack paid subscribers, merch, or any other monetization tied to the media business.
These five numbers, logged weekly, tell you more than any platform dashboard.
Build an Episode Pipeline Before the Recording Calendar
Most podcasters plan their schedule in reverse: they have a recording date, then scramble for a topic. A better approach is maintaining an episode pipeline with at least 4–6 topics queued ahead of production.
For each episode in your pipeline, log:
- Episode title or topic
- Guest name (if applicable) — confirmed or just ideated
- Format — solo, interview, roundtable, case study
- Status — Idea / Scheduled / Recorded / Edited / Published
- Release date — confirmed or target
When you have this pipeline visible, you can see gaps in your schedule before they become emergencies. You know which guests you need to follow up with. You see which formats you’ve been overusing (five consecutive interview episodes, for example).
Track Newsletter Issues from Draft to Analytics
A newsletter issue pipeline works the same way. For each issue:
- Subject line draft (or final)
- Send date
- Status — Idea / Draft / Editing / Scheduled / Sent
- Open rate post-send — logged 48 hours after sending
- Notable performance — anything unusually high or low, and a hypothesis about why
The open rate field logged per issue, over time, creates a running picture of what resonates with your audience. If issues about your personal experiences consistently outperform your interview digests by 10 points of open rate, that’s editorial signal.
Manage Your Sponsor Pipeline Like a Sales Funnel
For a 1-person media business, sponsorship revenue is often the most valuable income stream and the most poorly tracked. Most creators have a vague mental model of “brands I should reach out to” rather than an actual pipeline.
A basic sponsor pipeline has six fields per prospect:
- Brand/company name
- Contact name and email (if known)
- Status — Cold / Pitched / In Conversation / Offer / Active / Closed
- Offer amount — what you asked for or what was offered
- Deliverables — episode mentions, newsletter placement, social posts
- Deadline — when the deal needs to close or the campaign needs to run
A pipeline with 12 prospects at various stages is very different from a pipeline with 2. The first tells you where to focus follow-up energy. The second tells you you need to prospect more.
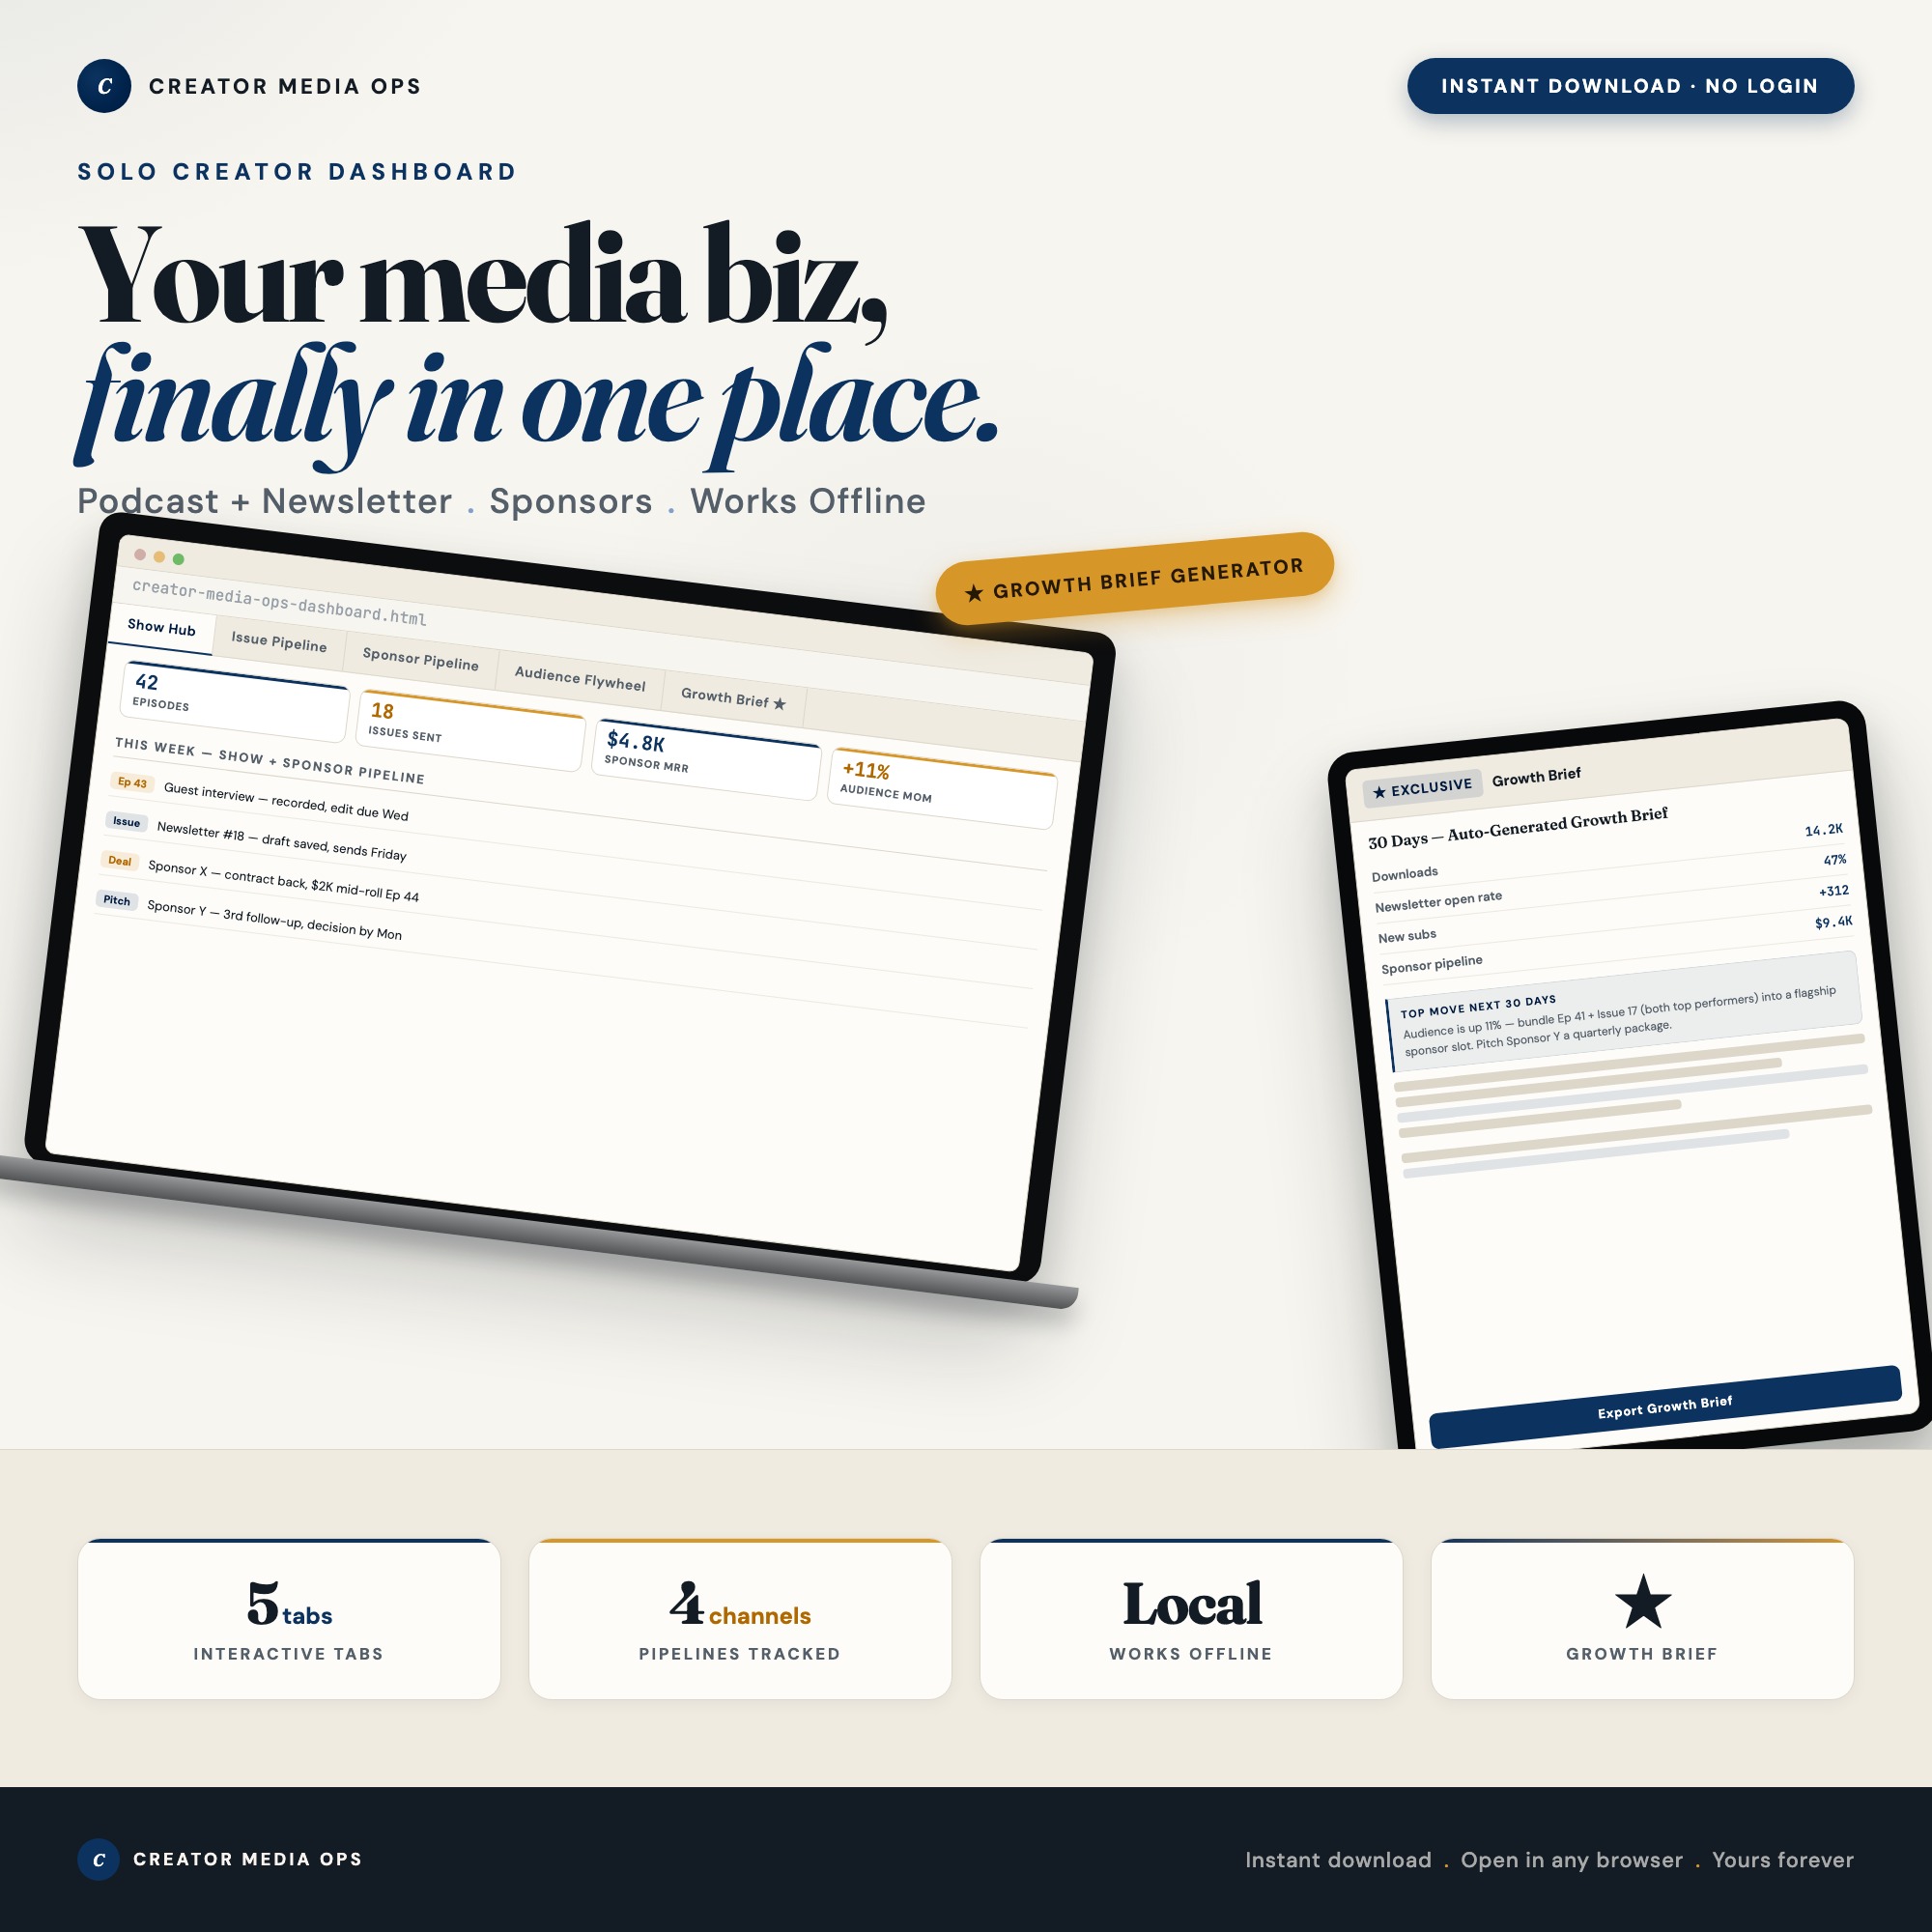
The Creator Media Ops Dashboard has a Sponsor Pipeline tab with these fields plus color-coded status chips. It sits alongside the Show Hub, Issue Pipeline, and Audience Flywheel tabs — all feeding the Growth Brief Generator, which reads all four and assembles a 30-day brief with channel-by-channel recommendations. That output is the thing no competitor ships as an interactive feature: a summarized action plan derived from your actual logged data.
A Monthly 30-Minute Growth Review
Once a month, close the analytics dashboards and open your single source of truth. Review:
- Downloads per episode this month vs. last month — is your podcast audience growing?
- Newsletter subscriber net change — how many new subscribers, how many unsubscribes?
- Open rate trend over the last 8 issues — improving, stable, declining?
- Sponsor pipeline status — how many active conversations, what’s the total pipeline value?
- Revenue this month — is the media business growing?
The honest answers to these five questions give you next month’s priorities. More guest outreach for the pipeline. A format experiment to address declining downloads. A re-engagement email to address churn.
One-time purchase at $25. Get the Creator Media Ops Dashboard at ListingResearchOS on Etsy.
Frequently asked questions
- Do I need special software to use an offline dashboard?
- No. An offline HTML dashboard like the Creator Media Ops Dashboard is a single file you open in any browser — Chrome, Edge, Safari, or Firefox. Nothing to install, no account to create.
- Is my data private if I use a browser-based dashboard?
- Yes, completely. Data stored in your browser's localStorage never leaves your device. There are no servers, no analytics, and no uploads of any kind.
- Can I back up my data?
- Yes. Every ListingResearchOS dashboard includes an Export Backup button that downloads a JSON file to your computer. Load Backup restores it on any device or browser.
- What makes an interactive HTML dashboard better than a spreadsheet?
- Spreadsheets require manual formula maintenance and lack purpose-built workflows. An interactive HTML dashboard has pre-built logic — like Growth Brief Generator — reads localStorage data from all 4 tabs, assembles a 30-day Growth Brief with recommendations per channel, exports as downloadable text file — that a spreadsheet can't replicate without significant engineering work.
- How much does the Creator Media Ops Dashboard cost?
- It is a one-time purchase of $25 on Etsy. No monthly subscription. Once you buy it, it is yours forever.
Ready-made dashboards
Skip setup — grab an interactive dashboard built for this exact workflow.
ListingResearchOS Shop
All dashboards — one-time purchase, yours forever
Single HTML files. No subscriptions. No login. Works offline in any browser.
Browse the Etsy Shop →