Online Course Revenue Projection: How to Forecast Your First Cohort
How to forecast online course revenue before you open the cart — audience size, conversion rates, price tiers, and the math that shows whether your
Published June 3, 2026
Most first-time course creators open the cart without doing any revenue math first. They have a course idea, an email list, and an optimistic feeling. When the launch underperforms, they can’t diagnose why — because they never defined what “performing” looked like in numeric terms.
A revenue projection doesn’t guarantee a successful launch. But it does tell you, before you build anything, whether your audience size and price point can realistically produce your revenue goal. That math takes 15 minutes. Not knowing it before you invest 200 hours in course creation is the expensive mistake.
This guide walks through how to build a credible first-cohort revenue forecast and use it to make a go/no-go decision before you commit.
The Revenue Projection Formula
A first-cohort revenue projection requires five inputs:
- Audience size — your email list count (not social followers; email converts 3–10x better)
- Email open rate — your average open rate over the last 60 days
- Sales page conversion rate — typical range for cold audiences is 0.5–2%; warm audiences who’ve been pre-launched can reach 3–5%
- Course price — your price tier (self-paced, cohort, live, VIP)
- Bonus tier upsell — if you offer a higher-tier option, the percentage of buyers who upgrade
The calculation:
- Audience x open rate = email readers who see your launch
- Email readers x click-through rate (typically 10–20% of openers) = sales page visits
- Sales page visits x conversion rate = core tier buyers
- Core tier buyers x average order value (blended with upsell) = gross revenue
Work through a concrete example. You have 1,500 email subscribers, a 38% open rate, and a $297 course. Your sales page converts at 2%. You offer a $497 VIP tier that 15% of buyers take.
- 1,500 x 38% = 570 email readers
- 570 x 15% click-through = 85 sales page visits
- 85 x 2% conversion = 1.7 buyers, rounded to 2 in the best case (this is why you pre-launch)
- With pre-launch warming and a warmer audience: 570 x 25% click x 3% conversion = ~4–5 buyers
- Blended AOV with upsell: $297 x 0.85 + $497 x 0.15 = ~$327
- Projected revenue: 4–5 x $327 = $1,300–$1,635
If your goal was $10,000, this audience size isn’t there yet. That’s the most important thing the model tells you: you need either a larger audience, a higher price, or a higher conversion rate before your goal is achievable.
What “Breakeven Enrollment” Tells You
Before you invest in building a course, calculate your breakeven enrollment count: the minimum number of students who need to buy to cover your production costs.
If you spend $2,000 on course production (video editing, platform setup, tools):
- At $297: you need 7 students to break even
- At $497: you need 5 students to break even
- At $997: you need 3 students to break even
This reframes the launch goal from “how do I get 50 students” to “how do I get 7 students.” The second question is more manageable and more directly actionable.
Plan the 12 Weeks Before Cart Open
Most failed course launches aren’t execution failures — they’re sequencing failures. Creators spend 10 weeks building the course and 2 weeks on the launch, when the ratio should be closer to 4 weeks building and 8 weeks warming the audience.
A 12-week pre-launch timeline:
- Weeks -12 to -9: Audience research. Survey your list about the problem you’re solving. Use their exact language in your sales page. Validate that the course you’re planning is the course they want.
- Weeks -8 to -5: Sales page and email drafting. Build the “path of belief” — the sequence of ideas that moves a subscriber from “I have this problem” to “this course is the solution.”
- Weeks -4 to -2: Beta and payment setup. Offer early access to 5–10 beta testers at a discount in exchange for feedback and a testimonial. Proves the course works before you sell it to your full list.
- Week -1: Pre-launch announce. Tell your list the cart is opening. Build anticipation.
- Week 0: Cart open, 5–7 day window.
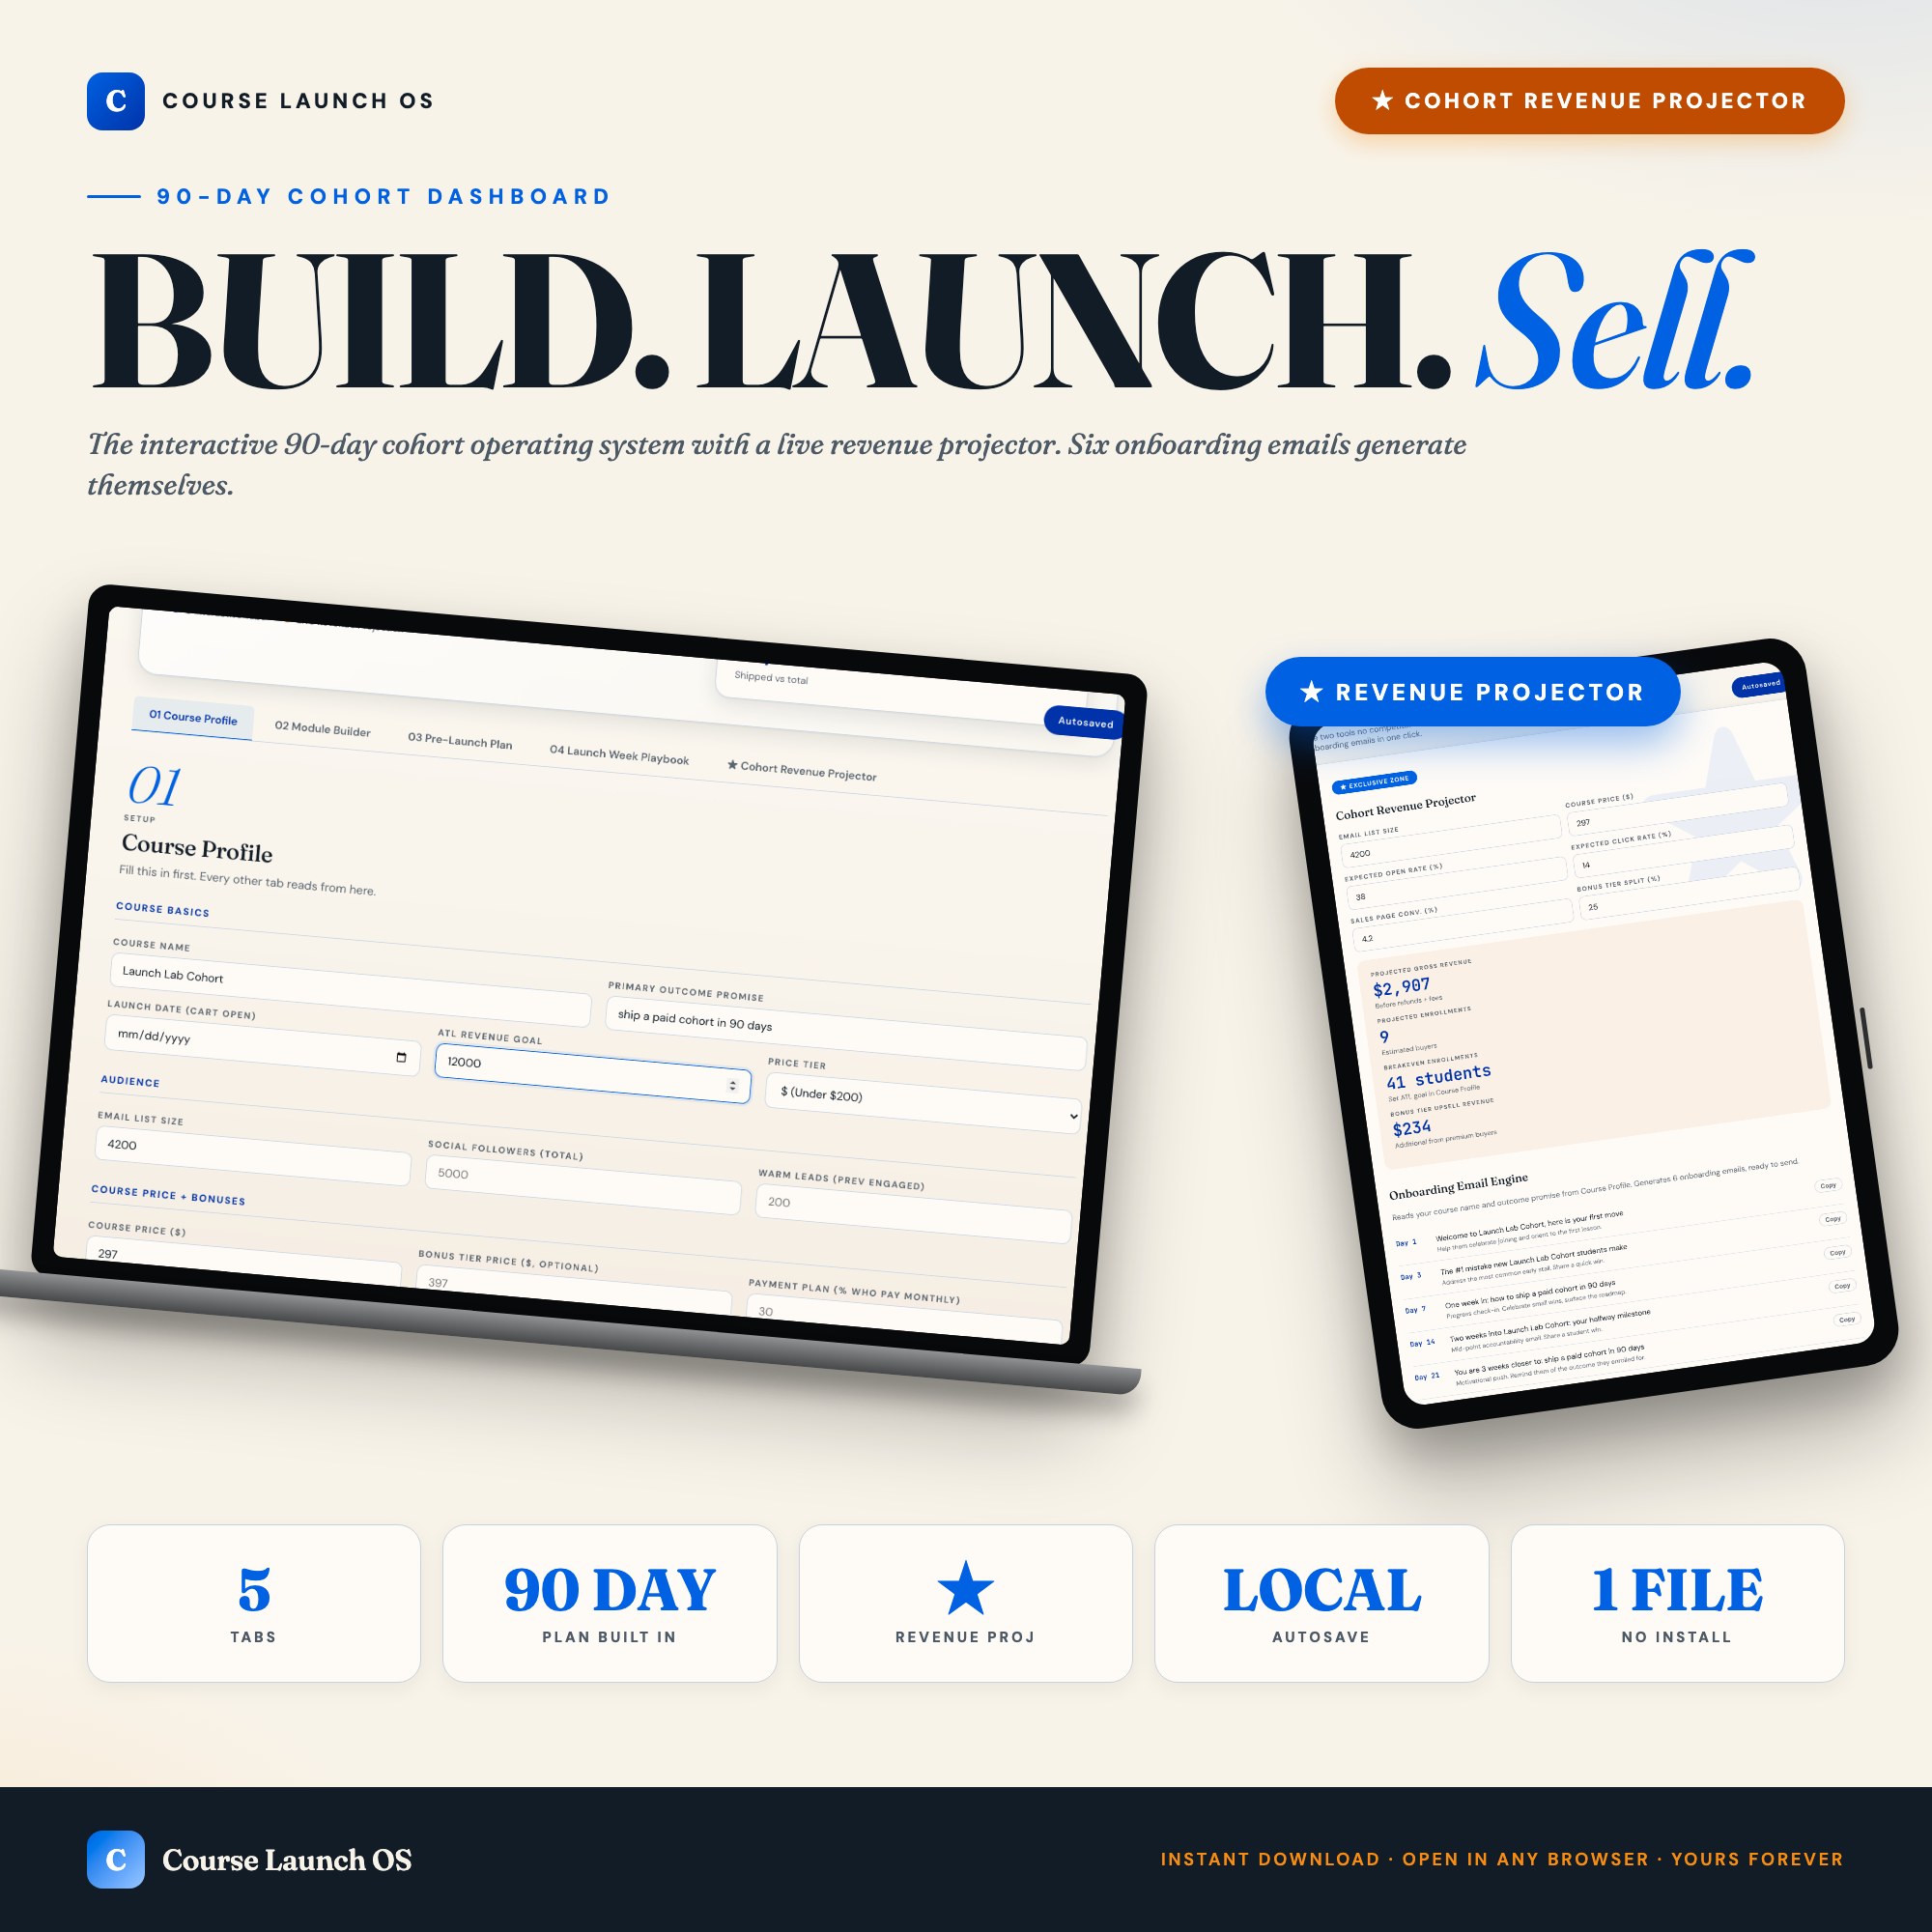
The Course Launch OS has a 12-week pre-launch grid that highlights the current week based on your launch date, a Launch Week Playbook with day-by-day email and social copy, and a Cohort Revenue Projector that recalculates in real time as you change any input. It also generates six onboarding emails (day 1, 3, 7, 14, 21, 30) the moment your course profile is filled. No other tool on Etsy ships this sequence builder alongside the revenue math.
What to Do When Your Projection Doesn’t Work
If your projection shows that your current audience size and price point can’t reach your goal, you have three real options — and only three:
Grow the audience first. If you need 50 students to hit your revenue goal but your list conversion math produces 4–5, the launch math doesn’t work. Delay the launch by 2–3 months and invest in audience growth: newsletter, SEO, YouTube, podcast appearances, or whatever channel already has traction for you. A 3x list size turns an impossible launch into a viable one.
Raise the price. Many first-time course creators undercharge because they don’t feel like “an expert yet.” The market doesn’t care about your feelings about expertise — it cares about the transformation you deliver. If a $297 price produces 4 students, a $497 price might produce 3 students and generate more revenue at lower volume.
Add a high-ticket tier. The math changes dramatically when 15–20% of buyers upgrade. A $297 base with a $997 VIP tier at 15% uptake raises your blended AOV from $297 to $402, which is a 35% revenue increase with no additional students.
None of these are fast solutions. The projection is telling you something true about your launch readiness. The correct response is to address the constraint, not to launch anyway and hope.
One-time purchase at $26. Find it at ListingResearchOS on Etsy.
Frequently asked questions
- Do I need special software to use an offline dashboard?
- No. An offline HTML dashboard like the Course Launch OS Dashboard is a single file you open in any browser — Chrome, Edge, Safari, or Firefox. Nothing to install, no account to create.
- Is my data private if I use a browser-based dashboard?
- Yes, completely. Data stored in your browser's localStorage never leaves your device. There are no servers, no analytics, and no uploads of any kind.
- Can I back up my data?
- Yes. Every ListingResearchOS dashboard includes an Export Backup button that downloads a JSON file to your computer. Load Backup restores it on any device or browser.
- What makes an interactive HTML dashboard better than a spreadsheet?
- Spreadsheets require manual formula maintenance and lack purpose-built workflows. An interactive HTML dashboard has pre-built logic — like Live cohort revenue projector + auto-generated onboarding email engine — that a spreadsheet can't replicate without significant engineering work.
- How much does the Course Launch OS Dashboard cost?
- It is a one-time purchase of $26 on Etsy. No monthly subscription. Once you buy it, it is yours forever.
Ready-made dashboards
Skip setup — grab an interactive dashboard built for this exact workflow.
ListingResearchOS Shop
All dashboards — one-time purchase, yours forever
Single HTML files. No subscriptions. No login. Works offline in any browser.
Browse the Etsy Shop →