7 Metrics Every Solo Realtor Should Track Weekly
The 7 weekly numbers that give solo realtors real business visibility — from weighted pipeline to lead source ROI — and why most agents track the wrong
Published June 3, 2026
Solo realtors often track the metrics their broker trained them to watch: total listings, days on market, and closed volume year to date. These are useful for annual reporting. They are not useful for running a week-to-week business.
Here are the 7 metrics that tell you what is actually happening in your pipeline and where next month’s income is coming from.
1. Weighted Pipeline Value
This is your single most important weekly number. For each active deal, assign a close probability (see below), multiply by your expected commission, and sum across all active deals.
Example: 6 active deals with expected commissions of $9,000-$16,000 each, weighted by probability (15% for early showings up to 90% for clear-to-close) = $34,500 weighted pipeline value. That is your realistic forward revenue estimate, not the optimistic number you would get by adding all expected commissions.
Review and update this every Sunday. It is the number that tells you whether your pipeline will sustain your income goals for the next 30-60 days.
2. Showings Per Week
Showings are a leading indicator of offers. Most agents have an intuitive sense of their conversion rate from showing to offer (typically 5-15% in competitive markets). Tracking your weekly showing count tells you whether your listing activity is generating enough buyer interest to sustain your close rate.
A consistent drop in showings 3-4 weeks before a listing decision point is often an early warning that a price adjustment is needed — not a conclusion you want to reach after 45 days on market.
3. Offer Stage by Deal
For every deal that has received or is generating offers, know the exact stage: initial offer submitted, seller response pending, counter sent, counter accepted, under contract. Each stage change affects your close probability and your forecasted timeline.
Log offer stage updates the day they happen, not at your weekly review. By Sunday, your pipeline should show accurate stages for every active deal.
4. Days Since Last Buyer or Seller Contact
Deals that stall often do so because communication frequency drops. A listing that has not had a showing in 12 days and where you have not spoken with the seller in 8 days is at risk of losing the seller’s confidence — which leads to harder conversations or, worse, a listing termination.
Track last-contact date per client. Any deal where contact is more than 5-7 days stale should be in your weekly call queue, not just the ones with active activity.
5. Projected Commission for the Month
Different from your weighted pipeline total. This is: of all deals with expected close dates this month, what is the probability-weighted commission I expect to collect in the next 30 days?
This metric tracks against your monthly income target. If you are 20 days into the month and your projected commission is $8,000 when your target is $18,000, you need to assess whether any current deals can accelerate or whether next month’s pipeline needs emergency attention.
6. New Leads by Source This Week
Where did your new leads come from this week — referral, open house, Zillow, social media, cold outreach, sphere-of-influence? Log each one.
Over 90 days, this data tells you which marketing channel has the best conversion rate and generates the highest-commission deals. Without a weekly log, you are estimating when you should be measuring.
7. Lead-to-Showing Conversion Rate
Of the new leads you generated last month, what percentage became showings? This is the metric that tells you whether your initial follow-up and qualification process is working.
A low lead-to-showing rate with a high lead volume means you are generating interest but failing to convert it to activity — which usually means a follow-up timing or messaging problem. A high rate with low volume is an awareness problem.
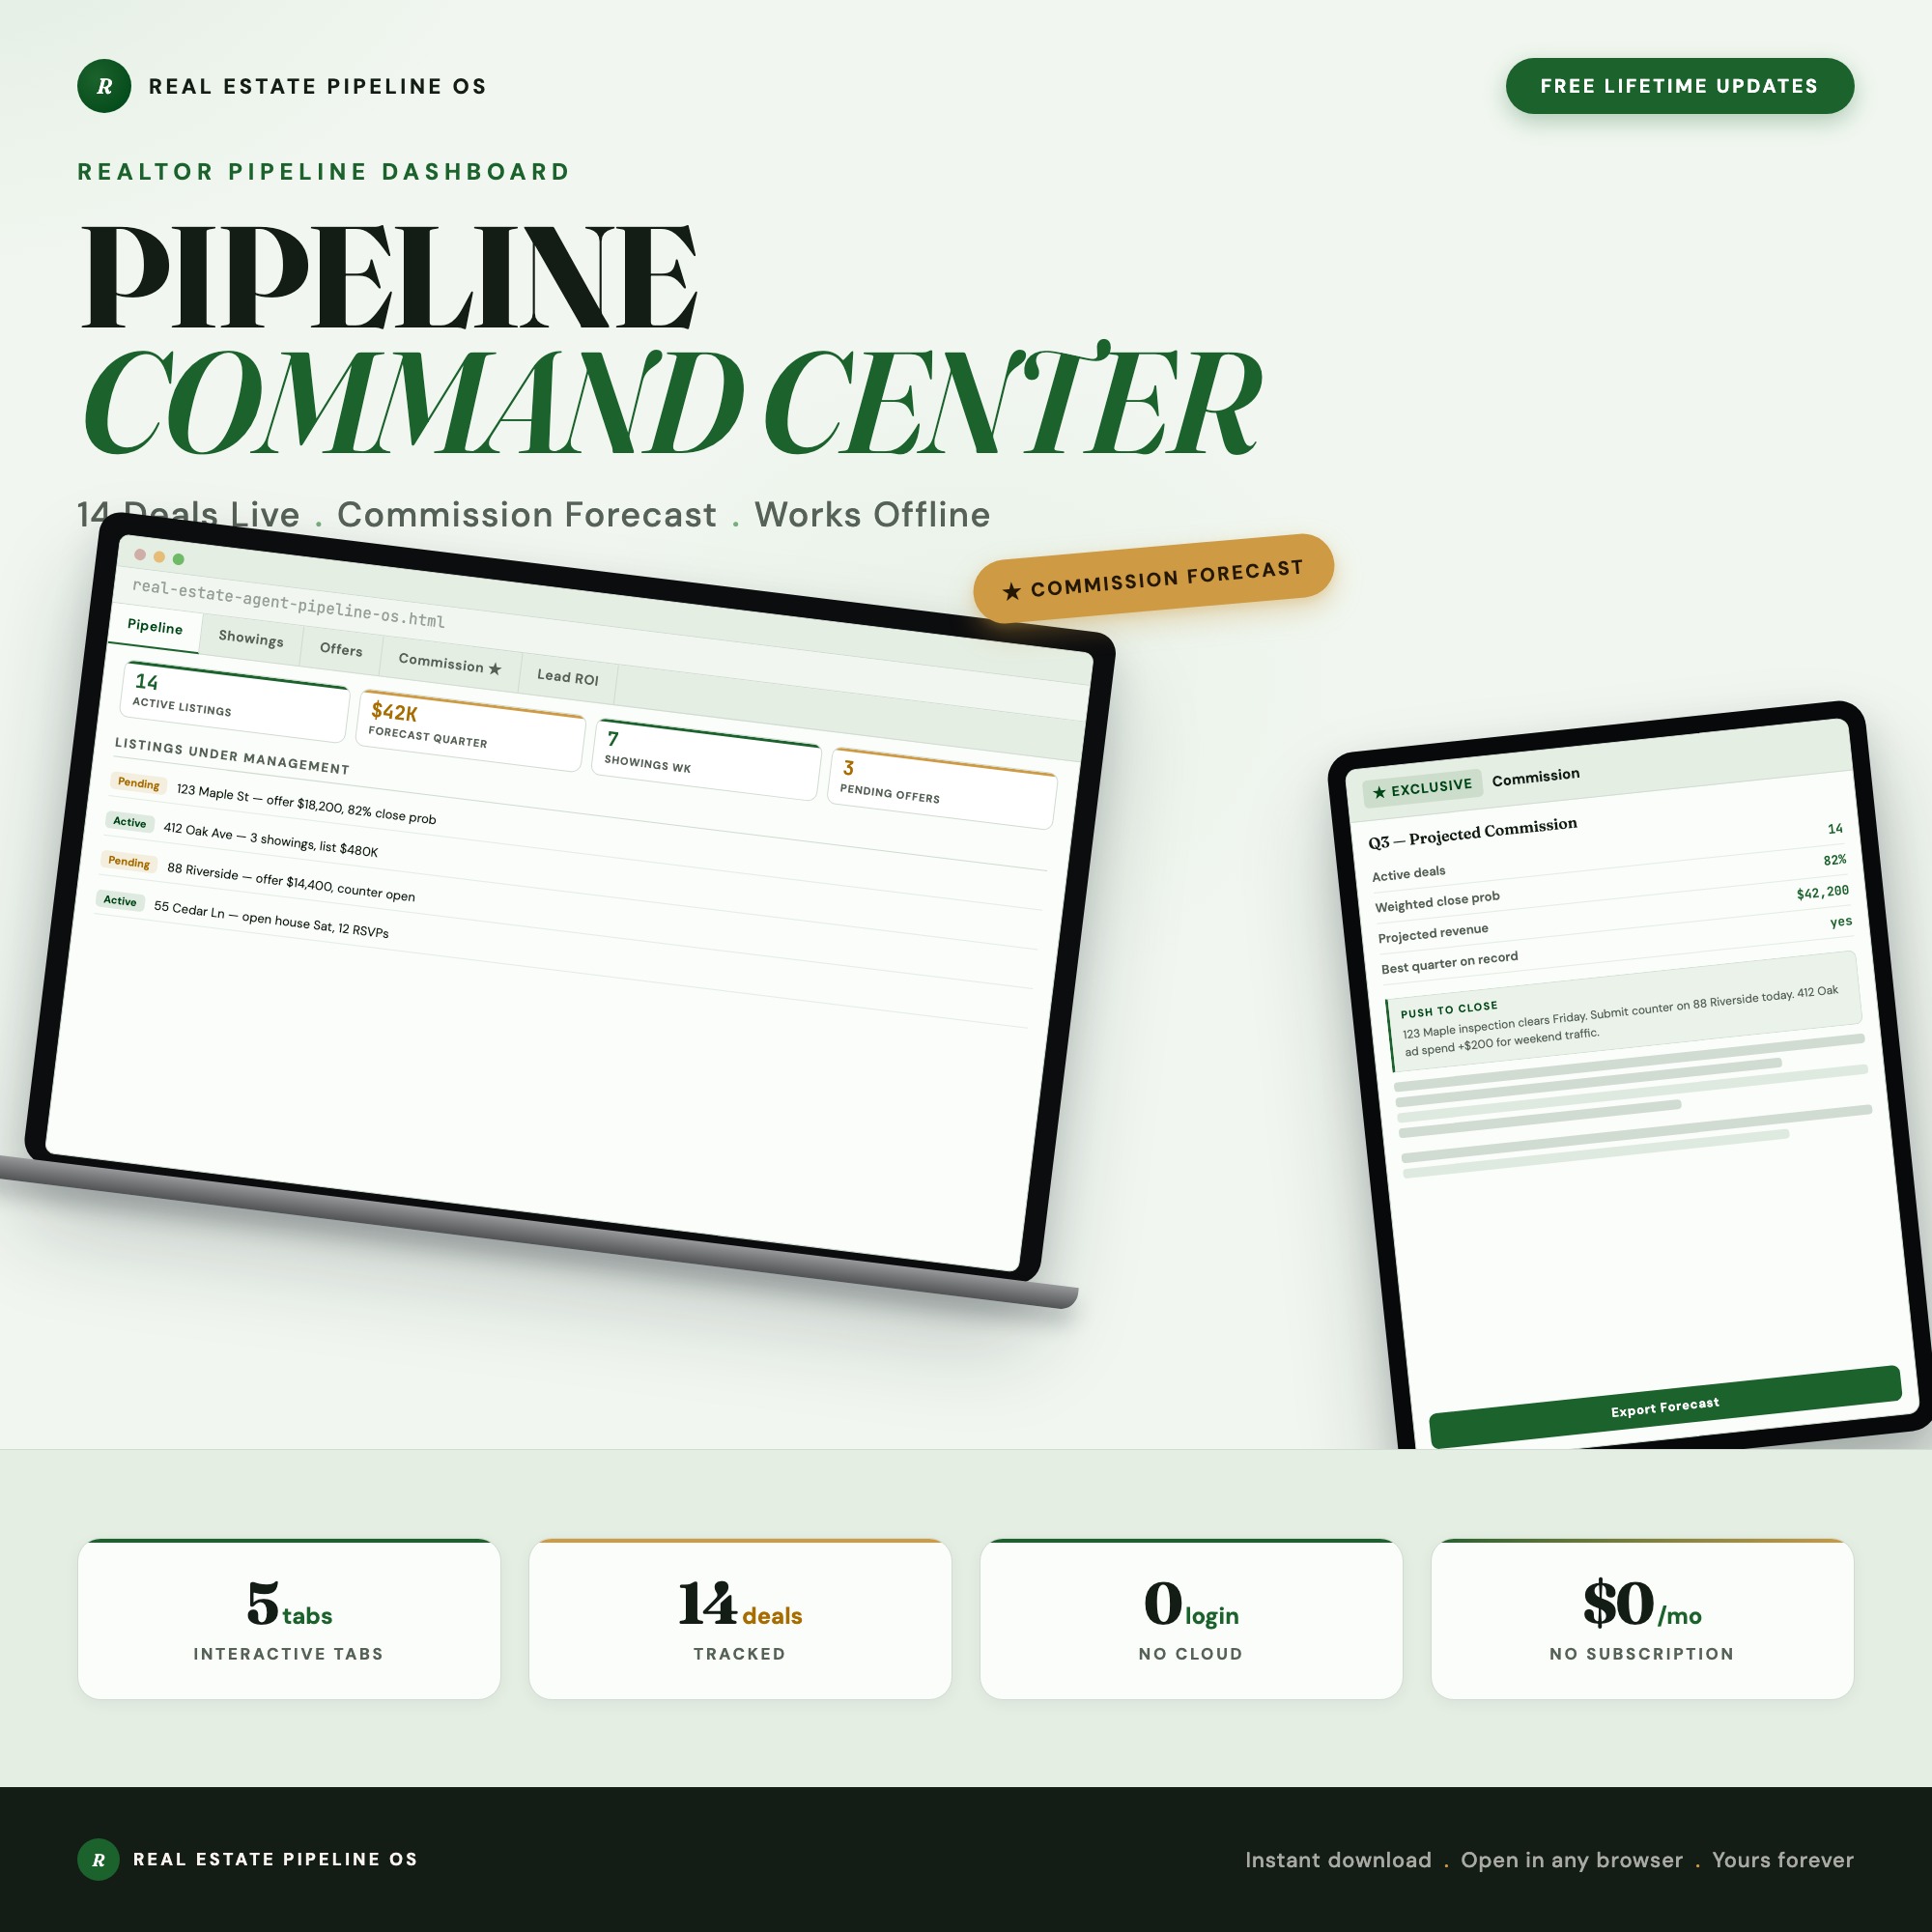
Tracking all 7 weekly requires a pipeline view, a showings log, an offer stage tracker, a contact recency field, and a commission forecast in one place. The Real Estate Agent Pipeline OS covers exactly this: Pipeline tab with deal stages, Showings Calendar, Offer Tracker, Commission Forecast with close-probability weighting, and Lead Source ROI analysis.
At $24 one-time, your client data stays on your device — no CRM subscription, no Etsy API. Available on Etsy.
Frequently asked questions
- How long should a solo realtor's weekly business review take?
- 30-45 minutes. Review pipeline status for every active deal, update close probabilities, log week's showings, flag any offers or counteroffers, and update your commission forecast. A clean pipeline review prevents surprises at the end of the month.
- Do I need to spend a lot of money on tools?
- No. The Real Estate Agent Pipeline OS costs $24 as a one-time purchase — less than two months of most subscription tools. And it is purpose-built for your workflow.
- What makes an offline HTML dashboard better than a subscription app?
- Cost (no $99/month CRM subscription), privacy (your client data stays on your device), and the Commission Forecast with Close-Probability Weighting — the only real estate tracker on Etsy that projects monthly income before the month closes.
- How quickly can I get started with the Real Estate Agent Pipeline OS?
- Under 5 minutes. Download the file, open it in any browser, and start using it immediately. Everything autosaves automatically.
Featured dashboards from this list
Interactive HTML dashboards — one-time purchase, works offline, no subscription.
ListingResearchOS Shop
All dashboards — single file, yours forever
Interactive HTML. No subscription. Works offline in any browser.
Browse the Etsy Shop →