Real Estate Commission Forecast: How to Project Your Monthly Income
How solo realtors can build an accurate monthly commission forecast using close-probability weighting — no CRM, no spreadsheet formulas required.
Published June 3, 2026
The most financially stressful part of a solo real estate practice is not slow months — it is not knowing which month is going to be slow until it already is. Commission income is inherently lumpy. Deals fall through. Closings shift by 30 days. And if you do not have a systematic way to project your pipeline, you are always reacting to the income that hits your account rather than managing what is coming.
This guide covers how to build a real estate commission forecast that is actually useful — one that projects monthly income from your active deals before the month closes.
The Problem With Gut-Feel Forecasting
Most solo realtors mentally tally their active deals and ballpark a number. The problem is that mental tallies overweight recent activity and ignore close probability. A deal that is three weeks from closing and a deal that has been “almost under contract” for two months carry very different probability weights — but in a mental tally, they show up as equals.
The result is a forecast that feels optimistic and delivers disappointing months.
Close-Probability Weighting: The Core Method
A close-probability weighted forecast works like this: for each active deal, assign a probability (0-100%) that it closes within your forecast window. Then multiply the expected commission by that probability.
Example:
- Deal A: $550,000 listing, 2.5% commission = $13,750. Probability: 85% (under contract, clear to close). Weighted: $11,688.
- Deal B: $420,000 listing, 2.5% commission = $10,500. Probability: 40% (offer pending, competitive). Weighted: $4,200.
- Deal C: $380,000 listing, 2.5% commission = $9,500. Probability: 20% (showing activity, no offer). Weighted: $1,900.
Forecast for the month: $17,788 — not the $33,750 you would get if you counted all three as certain.
This method consistently outperforms gut-feel forecasting because it forces honest probability assessment rather than wishful pipeline math.
How to Assign Probabilities That Are Actually Useful
Tie probability to deal stage, not optimism level. Here is a practical framework:
- Active / Showing (no offer): 10-25%. Some of these become offers. Most do not.
- Offer submitted, not accepted: 30-50%. Competitive markets push this lower.
- Under contract, inspection period: 55-70%. Deals fall out at inspection more than agents expect.
- Under contract, past inspection, clear to close: 80-90%. Wire transfer risk exists but is low.
- Signed, waiting on lender: 85-95%. Delays happen; cancellations are rare.
These are starting points. Adjust based on your market, your buyer’s situation, and your track record. If you historically close 70% of deals that go under contract, use that number, not an industry average.
Projecting Monthly vs. Quarterly Income
For cash flow planning, you need two views:
Rolling 30-day forecast: What commissions are likely to close in the next 30 days? Use the probability weights above applied only to deals with expected closing dates in that window.
Quarterly pipeline view: What is your weighted total across all active deals regardless of expected close date? This tells you whether your current pipeline can sustain your revenue needs for the quarter.
A healthy solo practice has $30,000-$60,000 in weighted quarterly pipeline per $150,000 of annual gross income target. If your weighted pipeline falls below one quarter of your annual target, you have a lead generation problem, not a closing problem.
Tracking Your Pipeline in One Place
Running this forecast manually in a spreadsheet requires maintaining close-probability columns, calculating weighted commissions, and rebuilding the view each month. Realtors with 15-25 active deals find this collapses quickly.
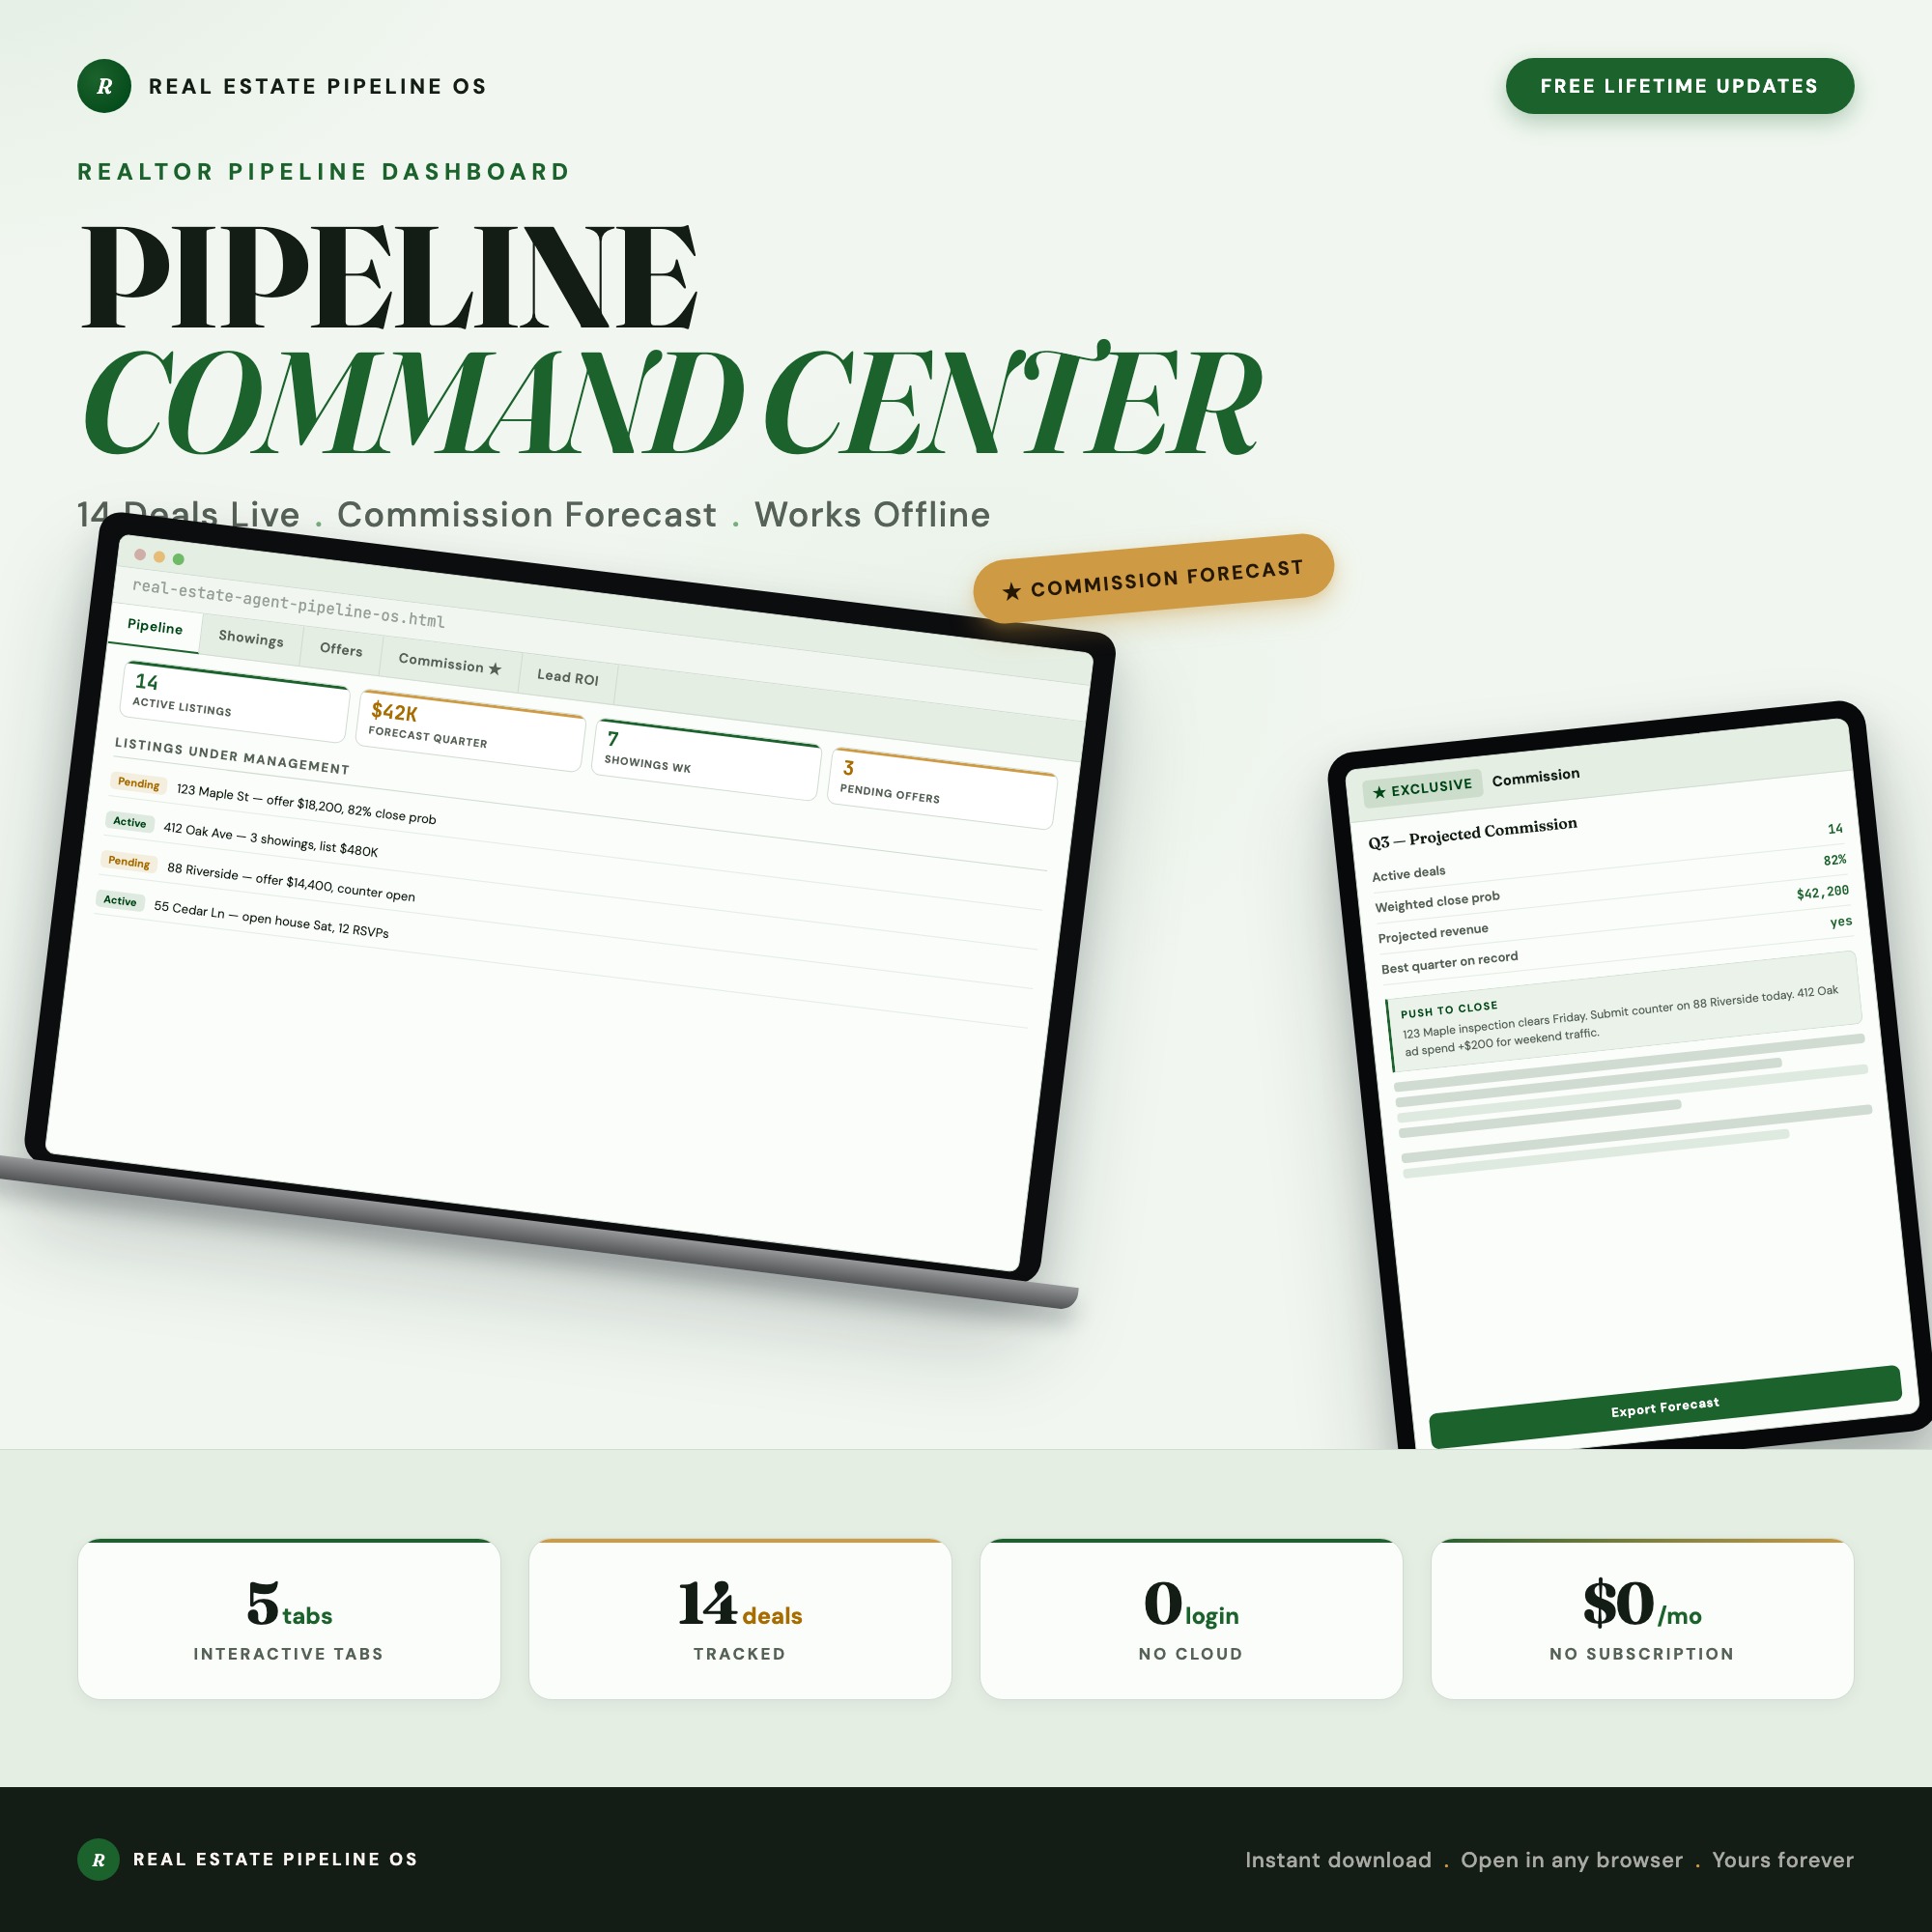
The Real Estate Agent Pipeline OS is a browser-based dashboard built specifically for solo realtors managing 10-30 deals. It includes a dedicated Commission Forecast tab — the only real estate tracker on Etsy that projects monthly income using close-probability weighting before the month closes.
Beyond the forecast, the dashboard tracks your full pipeline in tabs covering active listings, showings calendar, offer and counter tracking, and lead-source ROI (so you know which marketing channel generates your highest-commission deals). Everything saves automatically in your browser — no CRM subscription, no Etsy API access required, no cloud account. At $24 one-time, it replaces a spreadsheet that breaks and a CRM you use at 20% capacity.
Your pipeline data stays private on your device. Export a JSON backup anytime.
Building the Forecasting Habit
The forecast is only useful if it is current. That means updating deal stages and close probabilities at least once a week — ideally every Sunday evening before the week starts.
A weekly 15-minute pipeline review accomplishes three things: it keeps your forecast accurate, it surfaces deals that have stalled (and need a follow-up call), and it gives you a real-time answer when your partner or business coach asks how the month is tracking.
Once you run the close-probability method for two or three months, you will start to recognize patterns in your own conversion rates. That feedback loop — comparing forecast to actual — is where the real calibration happens.
What a Strong Pipeline Looks Like
For a solo realtor targeting $150,000 gross annual commission:
- You need roughly 10-12 closed transactions at average commission of $12,500-$15,000.
- Your weighted 30-day forecast should show $10,000-$15,000 in high-probability deals most months.
- Your active pipeline should have 15-25 deals at any stage to sustain that close rate.
If your numbers fall short, the forecast tells you early — in time to adjust your outreach, not after the lean month has already arrived.
The Real Estate Agent Pipeline OS is available on Etsy for $24. No subscription required — download once, open in any browser, and know your projected income before the month closes.
Frequently asked questions
- Do I need special software to use an offline dashboard?
- No. An offline HTML dashboard like the Real Estate Agent Pipeline OS is a single file you open in any browser — Chrome, Edge, Safari, or Firefox. Nothing to install, no account to create.
- Is my data private if I use a browser-based dashboard?
- Yes, completely. Data stored in your browser's localStorage never leaves your device. There are no servers, no analytics, and no uploads of any kind.
- Can I back up my data?
- Yes. Every ListingResearchOS dashboard includes an Export Backup button that downloads a JSON file to your computer. Load Backup restores it on any device or browser.
- What makes an interactive HTML dashboard better than a spreadsheet?
- Spreadsheets require manual formula maintenance and lack purpose-built workflows. An interactive HTML dashboard has pre-built logic — like Commission Forecast with Close-Probability Weighting — the only real estate tracker on Etsy that projects monthly income from active deals before the month closes — that a spreadsheet can't replicate without significant engineering work.
- How much does the Real Estate Agent Pipeline OS cost?
- It is a one-time purchase of $24 on Etsy. No monthly subscription. Once you buy it, it is yours forever.
Ready-made dashboards
Skip setup — grab an interactive dashboard built for this exact workflow.
ListingResearchOS Shop
All dashboards — one-time purchase, yours forever
Single HTML files. No subscriptions. No login. Works offline in any browser.
Browse the Etsy Shop →